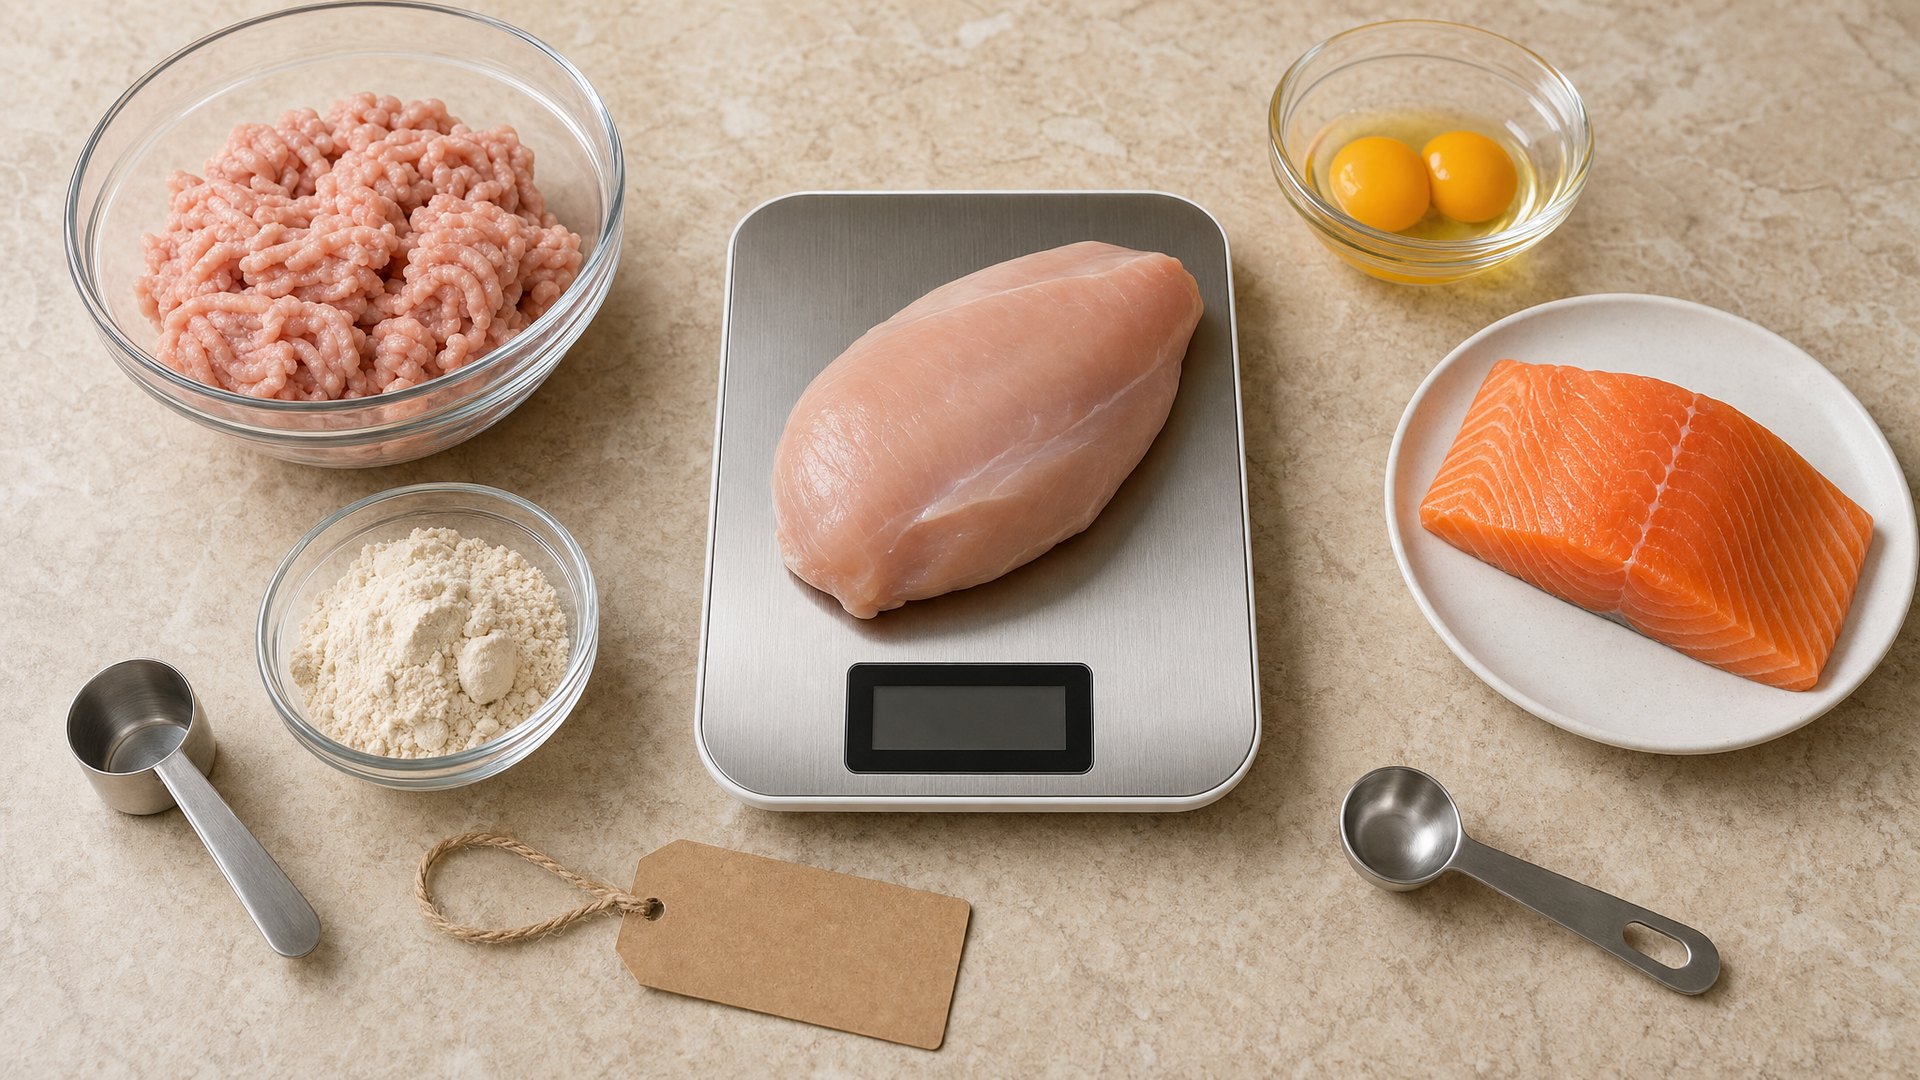
Are Recipe Protein Claims Accurate? We Checked 152 — Starting With Our Own
We checked 152 recipe protein claims against USDA data — hand-recomputed 19 popular external recipes and audited 133 of our own. The field held up; our own older recipes were the ones running high.
Part of The Protein Atlas — your complete guide to protein.
Across 19 popular high-protein recipes from major sites and creators, the protein claims held up: a median gap of just 3.6%, and not one inflated by more than 15%. We built a tool to catch inflated protein claims. The first recipes it caught were our own.
We expected the internet to round its protein numbers up. The data says the opposite — the misses ran low, not high. The one place claims really did run high was our own older recipes.
Popular recipe protein claims mostly hold up. When you check a claim, trust it if the recipe lists gram weights and a serving count — and recompute it yourself when a big share of the protein rides on one branded product’s label (a specific bread, a scoop of a named powder).
- The field: 19 popular recipes, median gap 3.6%, zero inflated over 15%. Two understated their own protein by more than 15% — estimated labels selling the creator short.
- Our own site was the problem child. Of 30 of our recipes our automated gate fully parses, 23 tripped it; hand recomputes confirmed two running 39–49% over their stated protein. Those are queued for correction.
- The fastest sanity check: raw meat grams × about 0.2 ≈ grams of protein — near 0.22 for lean cuts like chicken breast, closer to 0.19–0.20 for thigh or ground turkey. If a claim runs well above that, someone counted cooked weight as raw.
Every high-protein recipe online ends with a confident number: “42g protein per serving.” Almost nobody checks it. We wanted to know how accurate recipe protein claims really are, so we did the boring, verifiable thing — took published ingredient lists, pulled each ingredient’s protein from the USDA’s FoodData Central database, added it up, and divided by the stated servings. No copied macro boxes — every number below recomputes from its ingredients, with each assumption shown per line. A validator script re-runs all 19 external recomputes and fails loudly if a single figure drifts.
We checked two corpora: 19 popular recipes from major sites and creators, and our own 133 recipes. Here is the result in one table.
| Corpus | What we checked | Result |
|---|---|---|
| The field | 19 popular recipes (big sites, blogs, fitness creators) | Median gap 3.6%; 0 inflated >15%; 2 understated >15% |
| Our own site | 133 recipes (30 fully parsed by our gate) | 23 flagged; 2 confirmed running +39% to +49% high |
The honest headline is not “the internet lies about protein.” It is closer to the opposite — and the most inflated claims we found were sitting on our own domain. That is the story.
How Did We Check Recipe Protein Claims?
One method, applied the same way to every recipe:
- Quote the claim verbatim from the source page (the recipe-card nutrition line, or the creator’s stated number), with the URL and the date we accessed it. All 19 external recipes were retrieved on 2026-07-12.
- Take the published ingredient list and convert every item to a gram weight on a matched basis — raw or dry for raw ingredients, cooked weight paired with a cooked density where the recipe lists an ingredient already cooked.
- Multiply by USDA protein density — grams of protein per 100g, with the specific FoodData Central (FDC) ID recorded for each USDA line, and the brand label or explicit assumption noted where a line isn’t in USDA (a branded bread, a scoop of powder). FDC is the US government’s reference food database; “SR Legacy” is its standard-reference release, the one nutrition scientists cite.
- Divide by the stated number of servings and compare to the claim.
Why raw weights, not cooked? Protein is (approximately) conserved when food cooks — water leaves, protein stays. So multiplying raw ingredient weights by raw USDA densities is basis-proof: it gives the same protein whether you weigh the chicken before or after the pan. The mistake that inflates claims is mixing the two: applying a cooked protein density to a raw weight. More on that below.
We graded each claim against its recomputed value. The gap is (claim − computed) ÷ computed:
- HOLDS — within 10%. The claim is trustworthy.
- CLOSE — within 15%. Real but minor difference, usually an ingredient-weight assumption.
- INFLATED — more than 15% over (claim runs high) — or UNDERSTATED, more than 15% under (claim runs low).
For context, packaged food is held to a looser standard than this. FDA enforcement (21 CFR 101.9(g), eCFR retrieved 2026-07-12) only requires naturally-occurring protein to be at least 80% of the label — the law tolerates roughly 25% overstatement on a boxed product. Recipe blogs have no equivalent rule — those FDA standards cover packaged foods sold in stores, not the nutrition line on a recipe. Our 15% bar is stricter than the FDA’s, and we are applying it to content nobody is required to get right.
One honesty note up front: our automated gate fully parses 30 of our own 133 recipes; the other 103 are skipped because the gate’s ingredient matcher trips on plurals and aliases. So the numbers below are a mix of automated flags, full hand recomputes on the flagged and sampled recipes, and 19 external recipes recomputed line by line. We did not run 152 clean machine recomputes, and we will not pretend we did.
What Did the Audit Find on Our Own Site?
We ran our protein gate across all 133 recipes. It flagged 23 of the 30 it can fully parse. Before you read that as “our site is 77% wrong,” here is the important caveat: our gate is a tripwire, not a recompute. It checks the main protein ingredient plus a flat 5-gram buffer for everything else. Any recipe where beans, cheese, yogurt, or grains add more than 5g of protein registers as false “inflation.” So the flag count is a list of recipes to inspect, not a verdict.
So we inspected them by hand. Two were genuinely inflated:
Sheet Pan Chicken Fajitas — stated 43g, actually 28.8g. That is +49% over. Recomputed across 7 servings:
chicken breast raw 567g × 22.5/100 [FDC 171077] = 127.6 · 8 flour tortillas 360g × 8.01 [167535] = 28.8 · Greek yogurt 245g × 10.19 [170894] = 25.0 · cheddar 56.5g × 22.87 [173414] = 12.9 · peppers 360g × 0.99 = 3.6 · onion 150g × 1.1 = 1.6 · salsa 130g × 1.5 = 1.9 · cilantro/lime ≈ 0.1 → 201.5 ÷ 7 = 28.8g
Slow Cooker Chicken Tortilla Soup — stated 52.2g, actually 37.7g. That is +39% over. Across 4 servings:
chicken raw 454g × 22.5 [171077] = 102.2 · black beans drained 255g × 8.86 [173735] = 22.6 · corn 145g × 3.02 = 4.4 · broth 960g × 0.64 [174536] = 6.1 · cheddar 28g × 22.87 = 6.4 · sour cream 60g × 2.44 = 1.5 · avocado 100g × 2.0 = 2.0 · tomatoes 397g × 0.79 = 3.1 · vegetables 239g × 1.0 = 2.4 → 150.7 ÷ 4 = 37.7g
But the tripwire also cried wolf. Ground Turkey Taco Skillet — stated 48g — recomputes to 48.5g, off by 1%. It only tripped the gate because the gate ignores the beans, rice, yogurt, and cheese that carry about 40% of the protein. That recipe is fine, and we feature it below with the full math shown.
Our own gate flagged 23 recipes. Two were real inflation. One was the gate itself miscounting a recipe that was accurate all along. A tripwire tells you where to look, not what you’ll find.
The part where the tool caught the toolmaker
Here is the transparency the rest of this article rests on. On 2026-07-12, before publishing anything about other people’s accuracy, we re-verified every USDA code in our own tooling. We found that 56 of the 65 FDC codes in our protein-ranker dataset pointed at the wrong food. “Chicken thigh” resolved to New Zealand spinach. “Tuna, canned in water” resolved to crayfish. Alongside those, about 10 rows in our cost-per-dollar dataset carried stale protein values.
We fixed both datasets in the open and revalidated. The ranker corrections went in as one tracked code change (commit 7c129ef1) — firm tofu re-resolved from 8.1 to 17.3 g/100g, canned tuna in water from 29.9 to 25.5, and every food in the ranker re-checked against its FDC entry. The cost-per-dollar dataset and four already-published articles were corrected in a second (3fb2e5f2) — sirloin re-anchored, a double-counted brisket value removed. Each dataset now carries a validator that re-fetches every entry from the live USDA database and fails on any description or value drift. Both fixes are committed and revalidated but still staged for deploy, in the same correction queue as the two inflated recipes — a repair we are showing mid-flight, not a cleanup we finished quietly and never mentioned.
Why do our older recipes inflate when the external field does not? The root cause is documented and specific. Before 2026-03-26, our nutrition registry stored cooked protein densities but labeled them raw — chicken breast entered as 31 g/100g (its roasted value) and applied to raw ingredient weights. That single basis error inflated affected recipes by roughly 25–40%, with the worst cases running higher still. We corrected the registry, but a backlog of roughly 22 recipes built on the old values remains. The fajitas (+49%) and the tortilla soup (+39%) are fossils of exactly that mistake. They — and the rest of the backlog — are queued for the same line-by-line correction, and we would rather tell you that plainly than quietly feature them.
Do Popular High-Protein Recipes Actually Deliver?
Now the field. We searched for popular high-protein recipes that published both a full ingredient list and an explicit per-serving protein claim, quoted each claim verbatim, and recomputed it. Here are the 9 new recipes from major sites, blogs, and fitness creators (10 more come from our companion audit of viral cottage-cheese and creator recipes, aggregated into the stats below):
| Source | Claim | Computed | Gap | Verdict |
|---|---|---|---|---|
| Skinnytaste — Buffalo Chicken Rice Bowls | 49.5g | 50.1g | −1.2% | HOLDS |
| The Girl on Bloor — Sheet Pan Greek Chicken | 30g | 31.1g | −3.5% | HOLDS |
| Masonfit — Creamy Gochujang Noodles | 40g | 38.6g | +3.6% | HOLDS |
| Cheat Day Design — Anabolic French Toast | 50g | 51.2g | −2.3% | HOLDS |
| Autumn Elle — High Protein Pasta Salad | 35g | 42.5g | −17.6% | UNDERSTATED |
| Aubrey’s Kitchen — Anabolic French Toast | 16g | 16.4g | −2.4% | HOLDS |
| Budget Bytes — Apple Cinnamon Cottage Cheese Bowl | 13.6g | 13.2g | +3.0% | HOLDS |
| Lillie Eats and Tells — Chocolate Protein Overnight Oats | 22g | 21.0g | +4.8% | HOLDS |
| EatingWell — Balsamic Chicken Orzo | 39g | 37.2g | +4.8% | HOLDS |
One caveat on that table: the Masonfit row is our lowest-confidence check — its noodle protein is anchored to the pack’s calorie count rather than a printed protein label, so read that +3.6% as approximate.
Across all 19 external recipes (the 9 above plus the 10 viral ones), the numbers are better than we expected:
| Stat | Value |
|---|---|
| Median absolute gap | 3.6% |
| Median signed gap | +0.8% |
| Within 5% | 12 of 19 (63%) |
| Within 10% (HOLDS) | 14 of 19 (74%) |
| Within 15% | 17 of 19 (89%) |
| Inflated over 15% | 0 |
| Understated over 15% | 2 |
Those two medians measure different things: the absolute gap ignores whether a claim ran high or low, so it captures the typical size of a miss (3.6%); the signed gap keeps the + or − sign, so an overstatement here and an understatement there partly cancel out — which is why it lands lower, at +0.8%.
Read that honestly: the median claim is off by less than a gram in signed terms, and both claims that missed the 15% bar went the other way — they undersold the recipe’s own protein.
One disclosure that matters for how far you can push this: we kept every recipe we could find with both a full ingredient list and an explicit protein claim. Creators organized enough to publish both are plausibly more accurate than average. This is 19 checkable claims, not a random sample of the internet — so treat it as “recipes careful enough to show their work tend to be right,” not “everything online is honest.”
Which Protein Claims Held Up Best?
Some of these deserve to be named for getting it right, because the fair version of this audit praises accuracy as loudly as it flags error.
Skinnytaste’s Buffalo Chicken Rice Bowls claim 49.5g. We got 50.1g — within one gram:
chicken breast raw 680g × 22.5/100 [FDC 171077] = 153.0 · black beans drained 172g × 8.86 [173735] = 15.2 · brown rice cooked 585g × 2.74 [169704] = 16.0 · reduced-fat cheddar 56g × 27.35 [171292] = 15.3 · aromatics (onion, garlic) ≈ 0.7 → 200.2 ÷ 4 = 50.1g vs claim 49.5g
EatingWell’s Balsamic Chicken Orzo is a test-kitchen showpiece — 39g claimed, 37.2g computed (+4.8%), and the verdict does not budge when you stress-test the assumptions:
thighs raw 454g × 19.66 [173627] = 89.3 · whole-wheat orzo dry 255g × 13.87 [169738] = 35.4 · heavy cream 158g × 2.84 [170859] = 4.5 · spinach 142g × 2.86 [168462] = 4.1 · parmesan 25g × 28.42 [171247] = 7.1 · broth 720g × 0.64 [174536] = 4.6 · aromatics 236g × 1.7 = 4.0 → 149.0 ÷ 4 = 37.2g vs claim 39g
Swap in a lighter brand-label orzo cup weight and you get 36.3g; use homemade stock instead of packaged broth and you get 40.6g. The claim HOLDS across the whole range. That stability is what you’d expect from a number that was computed rather than eyeballed. The viral tikka masala from Stealth Health Life lands the same way — 48g claimed, 49.5g computed, off by about 3%.
Which Claims Missed — and in Which Direction?
Only two of 19 missed the 15% bar, and the direction is the surprising part: both understated.
- Autumn Elle’s High Protein Pasta Salad claims 35g; the ingredients compute to 42.5g (−17.6%). Even using conservative label values for the lentil pasta, it lands at −14.4% — still short of its own recipe.
- Good Food Baddie’s viral cottage-cheese wrap claims about 25.6g; the ingredients compute to 37.8g (−32.3%). The recipe delivers a third more protein than its own label says.
Neither of these is a creator inflating a number to look impressive. They are the opposite — recipes selling themselves short. The wrap looks like a recipe-card plugin miss: the little automated nutrition box most food blogs bolt onto every post matches ingredient names to a generic database, and when the match is loose or an ingredient is missing, the printed number drifts. Autumn Elle’s gap is a different flavor of the same problem — it hinges on how the lentil pasta’s protein is counted, a branded-label range rather than a mismatched database entry. In both cases the printed label doesn’t match the recipe’s own ingredients, and in our sample these automated labels drifted low. Your favorite blogger’s nutrition label is usually machine-generated, and the machine errs in both directions.
Why Do Recipe Protein Claims Go Wrong?
Four mechanisms account for nearly every gap we found. Each gets one worked example.
1. Raw-versus-cooked basis confusion. Chicken breast is 22.5 g/100g raw [FDC 171077] but 31.0 g/100g roasted [171477] — the same chicken, 38% denser after the water cooks off. Apply the cooked density to the raw weight you started with and every chicken recipe inflates by 30–40%. This is not a hypothetical: our own registry did exactly this before 2026-03-26, and our tortilla soup (stated 52.2g, actually 37.7g) is that failure mode preserved in amber. It is also why we recompute from raw weights — protein mass is conserved in cooking, so the raw basis can’t be gamed by whether you weighed before or after the stove.
2. Serving-size ambiguity — mostly sloppiness, not manipulation. The viral protein bagels claim “12g per bagel” on a recipe that says “divide into 4 to 6 portions.” At 6 bagels that is true (11.3g each); at 4 it is 17g each and the label understates by 29%. Our own fajitas say “Serves 7” over 8 tortillas. In every case it is under-specified division, not a trick — we found no external recipe using a serving-size sleight of hand to inflate a number.
3. Branded-label trust chains. Cheat Day Design’s 50g French toast is honest arithmetic — the ingredients genuinely add to 51.2g. But 32 of those 50 grams ride on Kroger’s CarbMaster bread label (4g per slice), which we cannot verify against USDA. That matters because the chain is only as strong as the label at the bottom of it — and in June 2026, Kroger paid $1.25M to settle a California suit — without admitting wrongdoing — that alleged CarbMaster bread’s calorie counts were printed at 30 when the real figure was closer to 50 (supermarketnews.com, heysocal.com, retrieved 2026-07-12). That suit was about calories, not protein — we are not claiming the protein number is wrong. The point is narrower and fair: when a recipe’s protein leans on one branded product, you have outsourced your accuracy to that product’s label. The same structure holds for the viral tiramisu (52% of its protein from one powder scoop’s label) and Lillie’s overnight oats (52% on Active Stacks’ 22g-per-scoop label, which we did verify on the brand’s site on 2026-07-12).
4. The “rounding-up culture” the data does not support. We came in expecting to find creators padding their numbers. The field’s median signed gap is +0.8%, and the only two misses beyond 15% both went under. The rounding-up story is real in exactly one place in this whole audit: our own pre-correction recipes. If you want to be suspicious of a protein claim, be suspicious of old content built on a bad reference table — not of the average careful creator publishing today.
One more trap: volume-scooped powder. A recipe that says “¼ cup vanilla protein powder” with no brand is genuinely uncheckable — powder density and per-scoop protein swing the answer by roughly ±20% depending on the product. We had to drop one recipe from this audit for exactly that reason. If a recipe leans on powder, weigh it in grams; a volume scoop is a guess. (For which powders actually deliver, see our Canadian protein-powder ranking.)
How Can You Sanity-Check a Protein Claim in 60 Seconds?
You do not need a spreadsheet. Four questions catch nearly every bad number:
- Does it state the number of servings? If not, the per-serving claim is meaningless — you can’t check division you can’t see.
- Does it give gram weights, or just cups? Grams are checkable; “1 cup cooked rice” can weigh noticeably more or less depending on how it’s packed.
- Does one branded product carry more than a third of the claim? A specific bread or a named powder scoop means you are trusting that label, not the recipe.
- Do the numbers roughly work? For a meat-based recipe, raw meat grams × roughly 0.2 ≈ grams of protein — use 0.22 for lean cuts like chicken breast, closer to 0.19–0.20 for thigh or ground turkey. The raw weight is printed on the package, so you don’t need a scale. A pound (454g) of raw chicken breast is about 100g of protein; split across 4 servings, that’s 25g each before anything else is added. If a claim sits far above that back-of-envelope figure, someone counted cooked weight as raw.
That last one is the whole game. It is the same arithmetic that caught our tortilla soup, and you can run it in your head at the stove.
Which of Our Recipes Survived the Audit?
First, the honest omission: the biggest protein numbers on our own site — several recipes claiming 60g or more per serving — are exactly the ones still on the correction backlog, flagged by our gate or not yet re-verified. We have deliberately left those off the list below rather than feature a number we haven’t checked. Here are six we are comfortable standing behind — each passes our gate cleanly or checks out on a full recompute:
- Honey Garlic Pork Tenderloin — 53.3g protein, 571 cal. Passes the gate with a +1.6g difference, the highest-protein clean pass in our set.
- Ground Turkey Taco Skillet — 48g protein, 600 cal. The one the tripwire wrongly flagged; here is why it is right: turkey 567g × 18.73 [172850] = 106.2 · black beans 255g × 8.86 = 22.6 · rice dry 278g × 7.13 [169756] = 19.8 · cheddar 56.5g × 22.87 = 12.9 · Greek yogurt 245g × 10.19 = 25.0 · vegetables and broth ≈ 7.6 → 194.1 ÷ 4 = 48.5g vs stated 48g.
- Turkey Breast Stir Fry with Vegetables — 46g protein, 400 cal. Gate pass, −0.8g.
- Air Fryer Teriyaki Salmon — 43.5g protein, 577 cal. Gate pass, −2.0g.
- Instant Pot Beef Stew — 43.5g protein, 442 cal. Gate pass, −1.2g.
- Asian Ground Pork Lettuce Wraps — 39.7g protein, 690 cal. Gate pass, −0.6g.
Want to check any single food’s protein yourself? Our Protein Ranker gives the USDA number per 100g, per serving, and per 100 calories, and links straight to the source entry.
The Bottom Line
Popular recipe protein claims are, in our sample, mostly accurate — median gap 3.6%, zero inflated past 15%, and the only two big misses undersold the recipe. The internet is not systematically padding its protein numbers. The inflation we did find was ours: two recipes running 39–49% high on a bad old reference table, now queued for correction, alongside a tooling bug we caught and fixed in the open.
If you create recipes: publish gram weights and a serving count, and proofread your recipe-card plugin’s number against your own ingredients — it errs in both directions. If you read them: trust a claim that shows gram weights and servings, and recompute the ones that lean on a branded product’s label. And this week, run the 60-second check on the next recipe you make — raw meat grams times roughly 0.2 — and see for yourself.
Frequently Asked Questions
Are recipe protein claims accurate? Mostly yes. Across 19 popular recipes we recomputed from their ingredient lists, the median gap was 3.6%, 14 of 19 landed within 10%, and none were inflated by more than 15%. Two understated their protein by more than 15%. The big exception was our own site’s older recipes, which ran 39–49% high before correction.
How much can a nutrition label legally overstate protein? On packaged food, FDA enforcement requires the actual protein to be at least 80% of the labeled amount (21 CFR 101.9(g)) — so the law tolerates roughly 25% overstatement. Recipe blogs have no equivalent rule — those FDA standards cover packaged foods sold in stores, not recipe nutrition boxes, which are unregulated and usually machine-generated.
Why do recipe protein numbers differ from MyFitnessPal or my own math? Three common reasons: raw-versus-cooked basis (chicken is 22.5 g/100g raw but 31.0 g/100g roasted), cup-weight ambiguity (a cup of an ingredient weighs noticeably more or less depending on how it’s packed), and branded-product labels that differ from the generic USDA entry. Weighing ingredients in grams removes most of the disagreement.
What is the most common direction of error in recipe protein claims? In our sample, understatement. The two claims that missed by more than 15% both ran low — auto-generated recipe-card labels underselling the creator’s own recipe. We found zero overclaims greater than 15% in the external field.
How do I verify a protein claim myself? Check four things: does it state servings, does it give gram weights, does one branded product carry more than a third of the protein, and do the numbers roughly work? For meat, raw grams × about 0.2 ≈ protein (0.22 for lean cuts like chicken breast, closer to 0.19–0.20 for thigh or ground turkey). A pound of raw chicken breast is about 100g of protein; if a four-serving recipe claims far more than 25g per serving from that chicken alone, someone counted cooked weight as raw.
Featured Recipes
All 6 recipes from this article, ready to cook
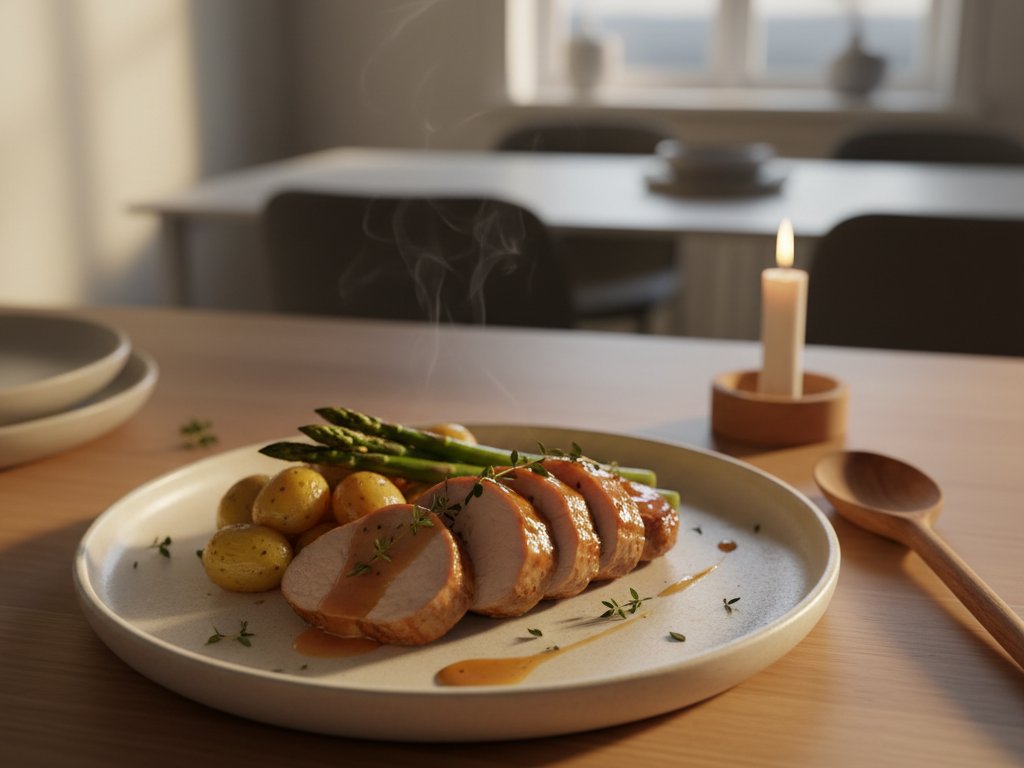
1. Honey Garlic Pork Tenderloin
Honey garlic pork tenderloin seared golden, then oven-roasted with a sticky glaze. Easy weeknight dinner with roasted vegetables. 53g protein.
View Recipe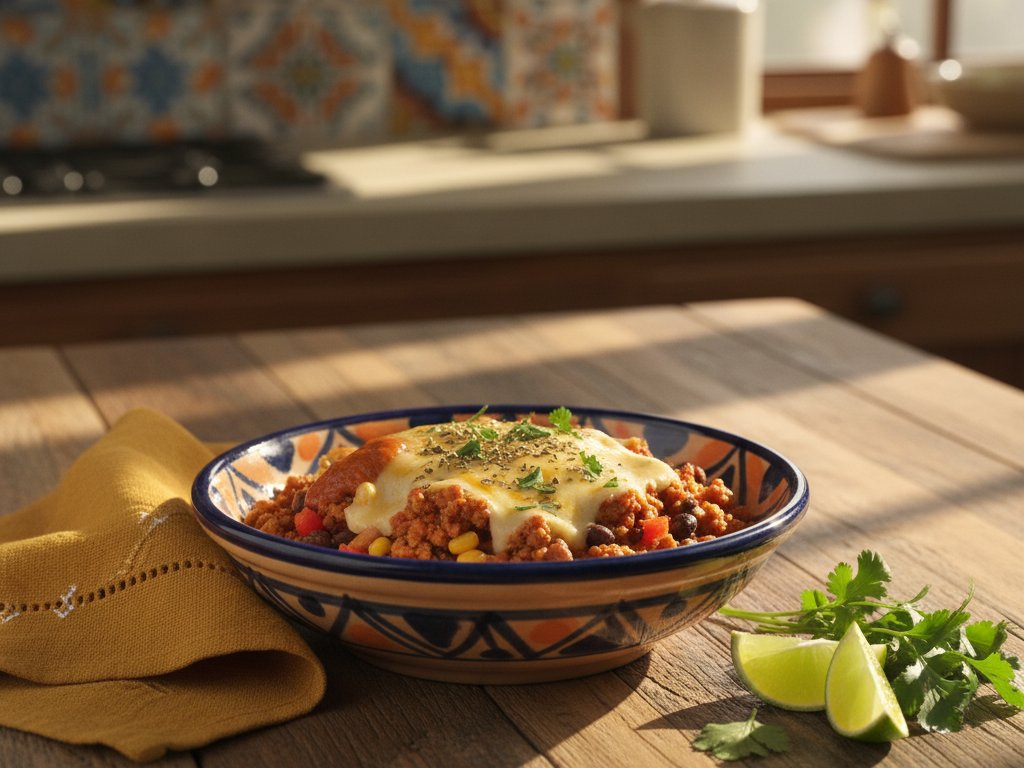
2. Ground Turkey Taco Skillet
Sizzling seasoned turkey with charred peppers, black beans, rice, and melted cheddar in one skillet. 42g protein, 574 cal, 40 min for 4 servings.
View Recipe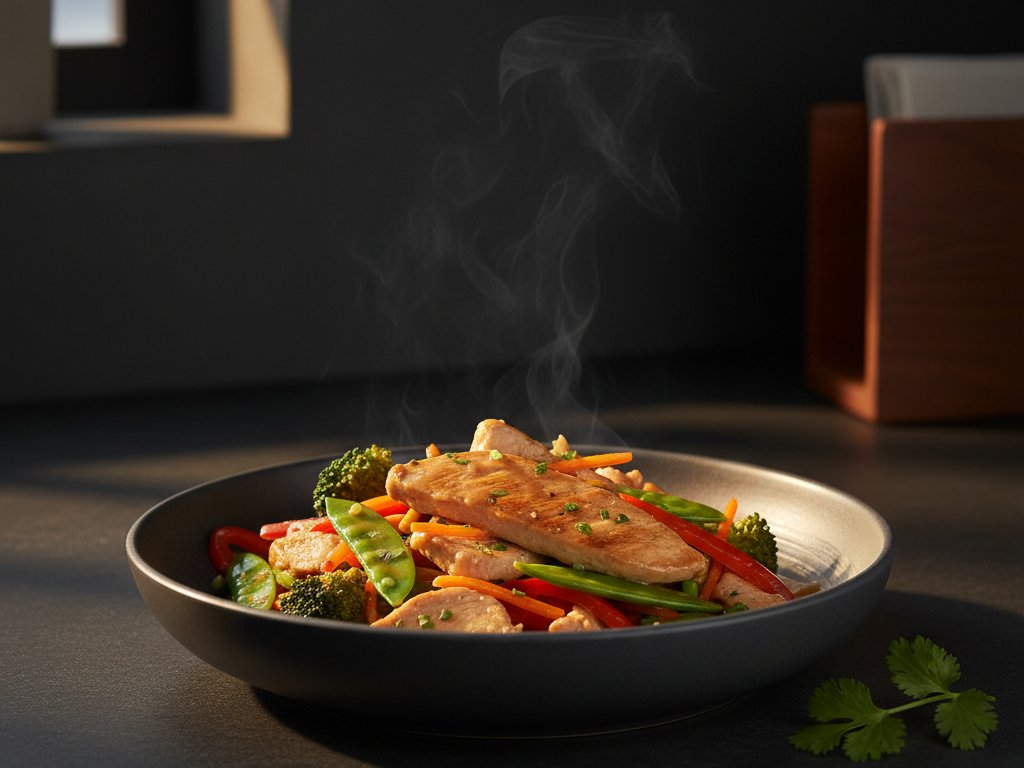
3. Turkey Breast Stir-Fry with Vegetables
Silky turkey breast stays juicy alongside crisp broccoli and snap peas in ginger-soy sauce. 46g protein, 400 cal.
View Recipe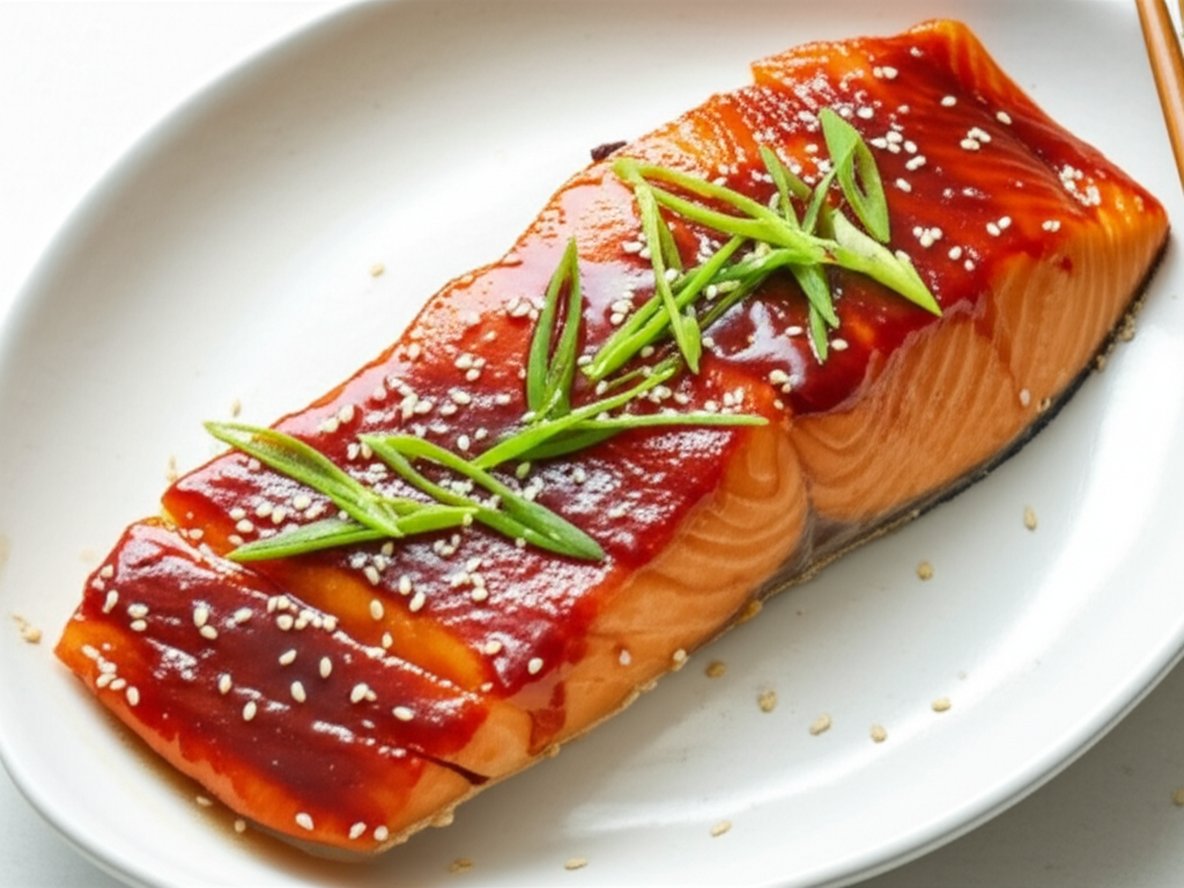
4. Air Fryer Teriyaki Salmon
Caramelized teriyaki glaze over buttery-flaky salmon fillets. 44g protein, 577 cal in just 25 min. Your air fryer's glossiest, most satisfying dinner.
View Recipe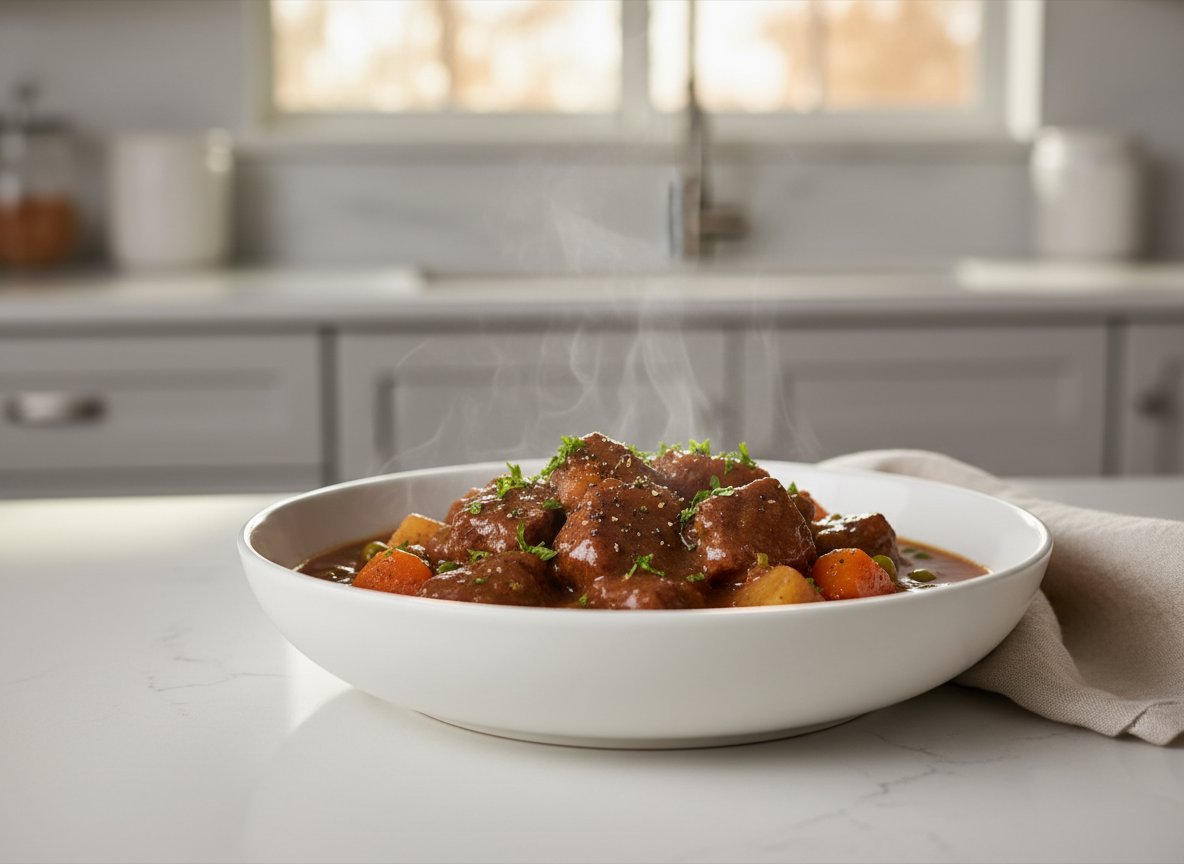
5. Instant Pot Beef Stew
Collagen-rich beef that falls apart at a touch. 44g protein, 442 cal in 75 min via pressure cooking. Rich gravy coats every bite.
View Recipe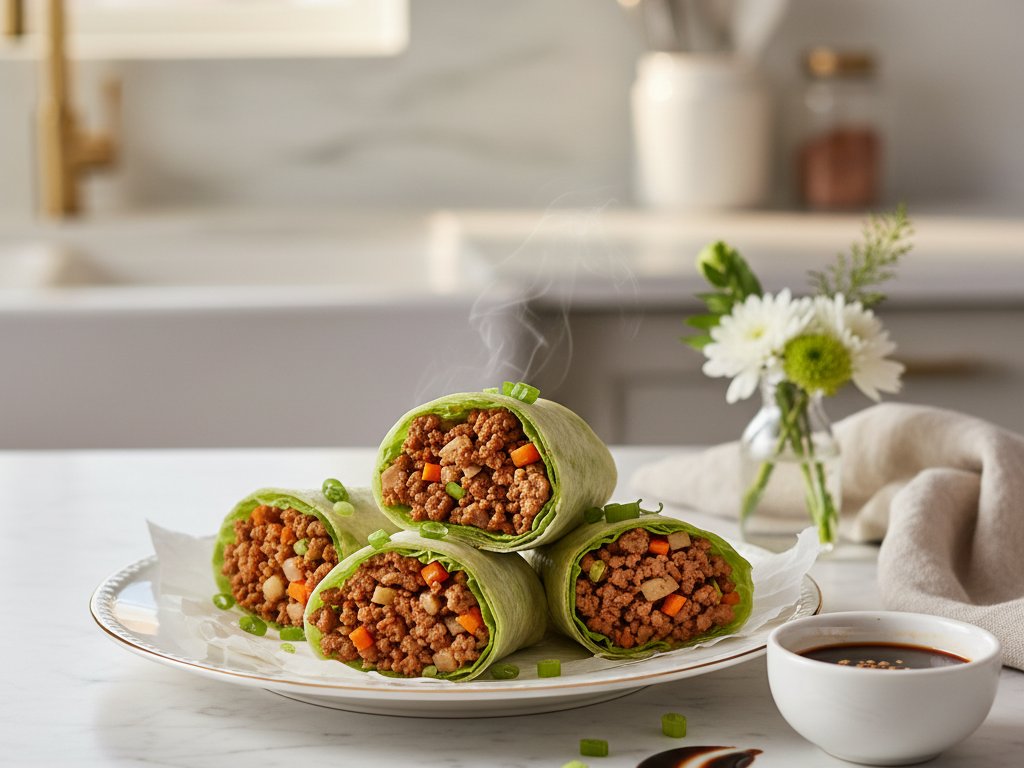
6. Asian Ground Pork Lettuce Wraps
Savory pork meets crunchy water chestnuts in hoisin glaze, wrapped in crisp butter lettuce. 40g protein, 690 cal, 20 min. Restaurant flavor, your kitchen.
View Recipe