Steak vs Chicken: Protein by the Cut, With Real Numbers
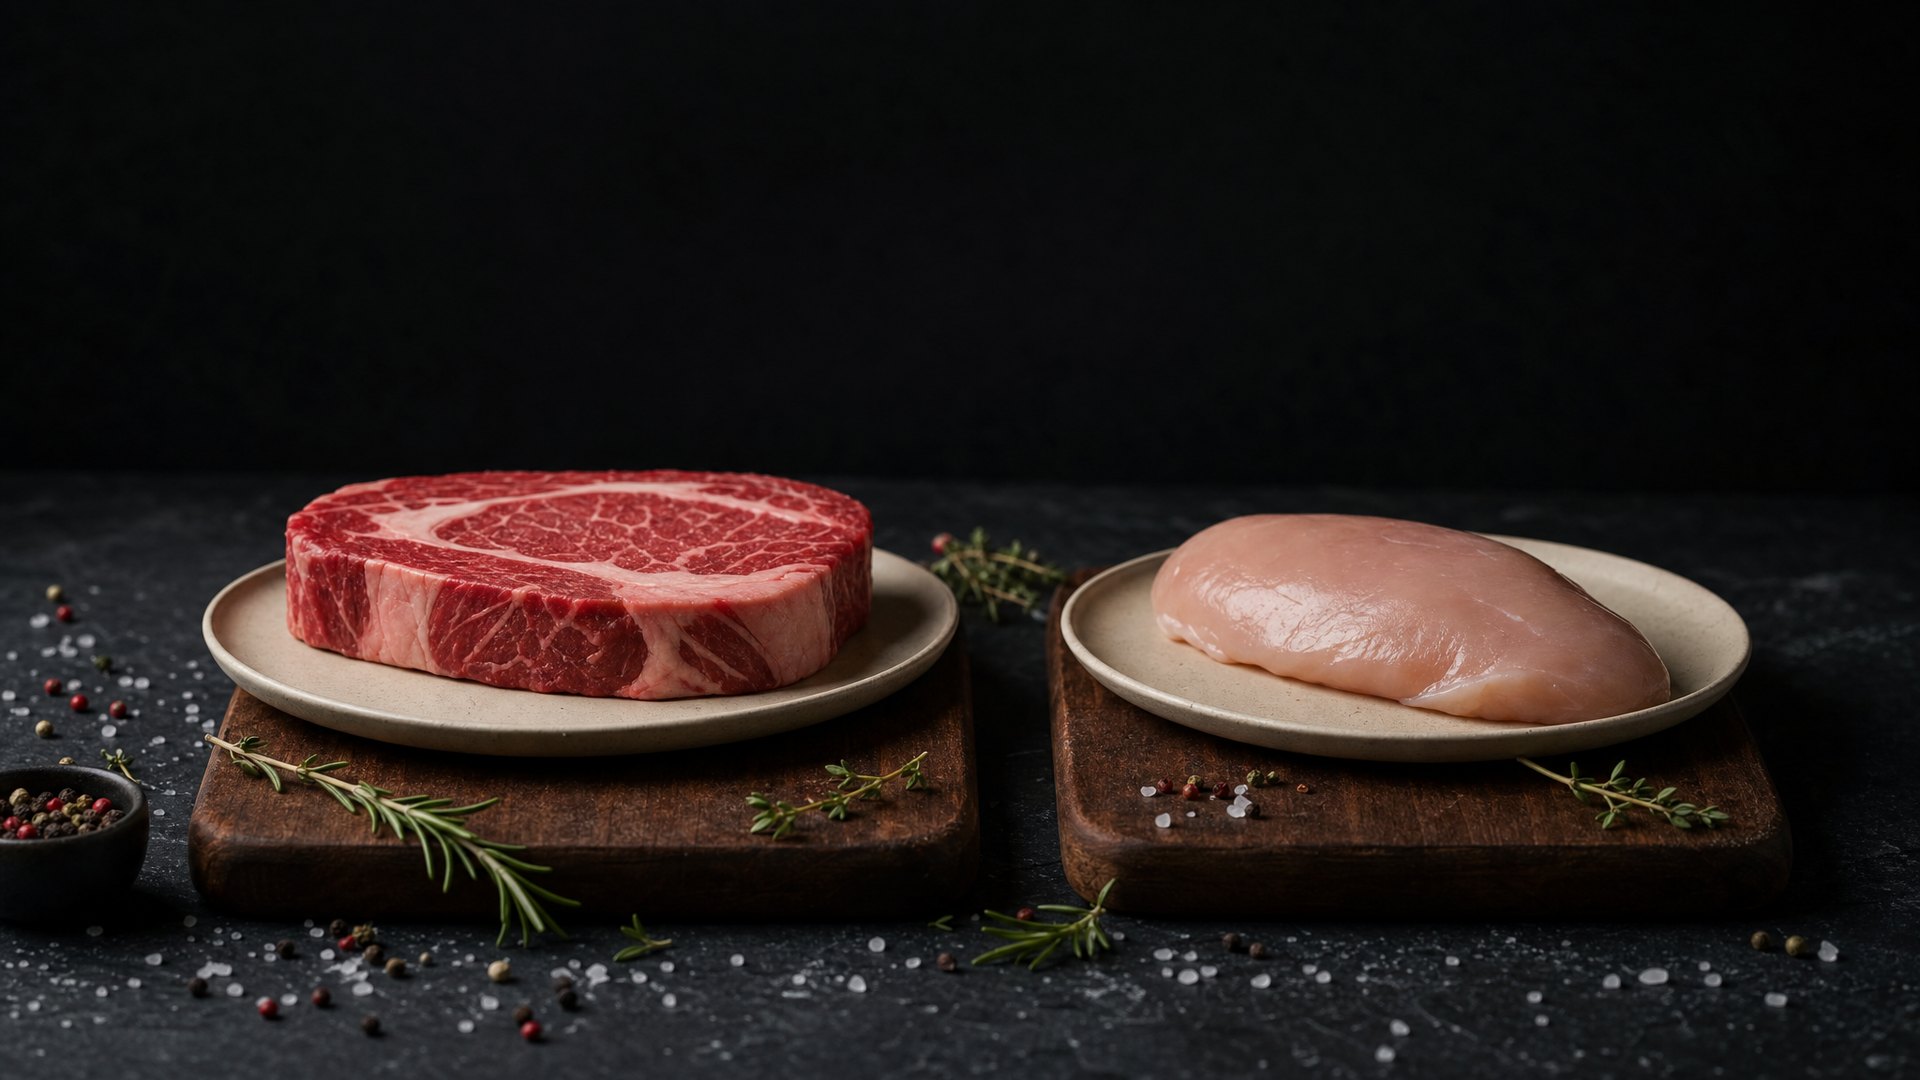
We compared eight steak and chicken cuts on cooked USDA protein, protein per calorie, and Canadian price per gram of protein. Breast wins as eaten, trimmed lean steak nearly ties, and the cheapest chicken protein costs 2.2 to 2.6x less than the cheapest steak.
Part of The Protein Atlas — your complete guide to protein.
Cooked chicken breast has 31.0 g of protein per 100 g; the steaks people actually buy run 22.9 to 27.6 g. Trim a steak hard, though, and the contest nearly disappears — lean-only top sirloin hits 30.6 g, eye of round 29.9. Most steak-vs-chicken articles stop at “they’re similar”; this one goes cut by cut, with USDA FoodData Central IDs on every row and Canadian prices on every dollar figure.
Cutting calories? Chicken breast is the protein-per-calorie champion at 18.8 g per 100 kcal — 1.4 to 2.5x any steak as sold. Want it to be steak anyway? Eye of round (18.0 g/100 kcal) nearly ties breast once trimmed.
Feeding a budget? Chicken wins without a fight: drumsticks deliver cooked protein at about $0.062/g CAD vs $0.137-0.163/g for the cheapest steak rows — chicken is 2.2 to 2.6x cheaper.
Chasing iron, zinc, and B12? Beef wins those by multiples — that’s what the steak premium actually buys.
Ribeye is a flavor purchase (7.6 g protein per 100 kcal), and that’s fine — just know which purchase you’re making.
One honesty note before the table, because it frames everything: at matched leanness, beef and chicken converge. Fat is more than twice as calorie-dense as protein, so a lean cut of anything scores high per calorie — that’s arithmetic, not a chicken superpower. The differences that survive the trim are the intrinsic ones: beef’s B12, zinc, heme iron, and creatine on one side; chicken’s lower leanness floor and lower price on the other. Those are what this comparison is really about.
How Much Protein Is in Beef vs Chicken Per 100g?
Here is beef vs chicken protein per 100g, cooked, as-eaten — every row live-verified against USDA FoodData Central on July 12, 2026 (search any row’s FDC ID at that link to pull up the raw USDA entry and check us yourself):
| Cut | Protein /100g | Calories | Fat | Protein /100 kcal | FDC ID |
|---|---|---|---|---|---|
| Chicken breast, skinless (roasted) | 31.0 g | 165 | 3.57 g | 18.8 g | 171477 |
| Beef eye of round, lean only (roasted) | 29.9 g | 166 | 4.26 g | 18.0 g | 170634 |
| Beef top sirloin, lean only (broiled) | 30.6 g | 183 | 5.79 g | 16.7 g | 168634 |
| Chicken thigh, meat only (roasted) | 24.8 g | 179 | 8.15 g | 13.9 g | 172388 |
| Beef flank, as sold (broiled) | 27.6 g | 202 | 9.31 g | 13.7 g | 169435 |
| Chicken drumstick, meat + skin (roasted) | 23.4 g | 191 | 10.2 g | 12.3 g | 173612 |
| Beef top sirloin, as sold (broiled) | 26.8 g | 257 | 15.8 g | 10.4 g | 168729 |
| Ground beef, 85% lean patty (broiled) | 25.9 g | 250 | 15.4 g | 10.4 g | 174032 |
| Chicken thigh, meat + skin (roasted) | 23.3 g | 232 | 14.7 g | 10.0 g | 173625 |
| Beef ribeye, as sold (grilled) | 22.9 g | 303 | 23.5 g | 7.6 g | 173390 |
Basis rules: “as sold” steaks use USDA’s separable lean and fat entries (1/8” trim for sirloin and ribeye, 0” for flank, choice grade — in shopping terms: “choice” is the mid-tier USDA quality grade most grocery steak is sold at, “1/8-inch trim” is roughly the fat cap on a pre-packaged steak, and “0-inch trim” means the external fat is fully removed) — the steak as it hits your pan. Bone-in chicken uses meat-and-skin entries, the way most people eat a drumstick. “Lean only” rows are the trim-it-yourself comparison. These eight cuts were chosen to span the range — from the leanest widely available beef (eye of round) to the fattiest common steak (ribeye) — not as a census of every cut at the counter.
Three things jump out:
- As eaten, breast beats every steak. 31.0 g vs 22.9-27.6 g for steaks as sold. That’s a 12-35% protein edge per 100 g before you even look at calories.
- Trimmed lean beef closes to a rounding error. Eye of round at 29.9 g and lean-only sirloin at 30.6 g sit within a bite of breast. The gap between “steak” and “chicken” is mostly a gap between fat levels, not animals.
- Chicken’s dark meat lands mid-pack. Thigh meat (24.8 g) and drumstick with skin (23.4 g) sit in the same protein territory as the fattier steaks — at a fraction of the price, as we’ll see.
Which Steak Cut Has the Most Protein?
Trimmed top sirloin, at 30.6 g per 100 g cooked (lean only, FDC 168634) — it edges eye of round’s 29.9 g. But “most protein” and “leanest” aren’t the same crown: eye of round carries less fat (4.26 g vs 5.79 g) and fewer calories (166 vs 183), so it wins per calorie, 18.0 to 16.7.
At the bottom sits ribeye, and the reason is worth understanding because it explains the whole table: fat displaces protein. Every gram of fat in a 100-gram portion is a gram that isn’t muscle fiber. Ribeye is 23.5 g fat per 100 g cooked — nearly a quarter of its weight — so its protein reads 22.9 g while sirloin, with 15.8 g of fat, reads 26.8. Same animal, same grade, about four fewer grams of protein per 100.
Ribeye is the least protein-dense steak on the table for the same reason it tastes the way it does: 23.5 grams of fat per 100.
Flank is the quiet overachiever here — 27.6 g protein as sold, because a flank steak carries almost no external fat to trim (USDA’s entry is 0” trim). If you want a steak that behaves like a lean cut without any knife work, flank is it. It’s the cut in our Steak Fajita Sheet Pan (47 g protein, 590 calories) and the Steak Tacos with Chimichurri (48.6 g, 670 calories).
Is Steak or Chicken Better for Protein Per Calorie?
Scoped honestly, in two answers:
Against steak as people actually buy and eat it: chicken breast, every time. Breast delivers 18.8 g of protein per 100 kcal (31.0 ÷ 165 × 100). Sirloin as sold delivers 10.4 (26.8 ÷ 257 × 100). Ribeye delivers 7.6 (22.9 ÷ 303 × 100) — breast is 2.5x ribeye per calorie. Across the as-sold steaks, breast’s edge runs from 1.4x against lean flank (13.7 g per 100 kcal) to 2.5x against ribeye.
Against beef trimmed to match: it’s nearly a tie. Eye of round lands at 18.0 g per 100 kcal — a 4% gap to breast’s 18.8. As we said upfront, that convergence is arithmetic: strip the fat from both and you’re comparing lean muscle to lean muscle. Anyone telling you chicken is inherently the lean-protein animal hasn’t priced an eye of round roast.
Protein’s thermic effect — the 25-30% of protein calories your body burns just digesting it, vs 5-10% for carbs and 0-3% for fat — applies to both animals equally, so it doesn’t break this tie; it just makes every row on the table slightly cheaper, calorie-wise, than the label suggests.
The practical read: if you’re cutting and you want the most protein for the fewest calories with zero effort, breast is the default — something like the Skillet Chicken Fajita Bowls at 36.9 g protein for 546 calories. If you’re cutting and sick of chicken, a trimmed eye of round or lean-only sirloin (ask the butcher counter to trim it, or slice the visible fat off yourself at home) costs you almost nothing in efficiency.
Which Is Cheaper Per Gram of Protein in Canada?
Chicken — and this is where the gap refuses to close no matter how you trim. Prices below are Statistics Canada monthly average retail prices for May 2026 (Table 18-10-0245-01, Canada average, released July 2, 2026), except eye of round and flank, which have no StatCan series and use Metro.ca regular prices found by web search on July 12, 2026 — provisional, see the caveats below. Cost per gram divides the shelf price by the cooked protein you actually end up with. The yield factor is the share of the raw weight you paid for that survives as cooked, edible meat: boneless cuts (chicken 0.72, beef 0.70) lose weight only to cooking, while bone-in chicken’s 0.50 covers both the cooking loss and the bone you paid for but can’t eat — that’s why the drumstick’s factor is so much lower than breast’s, not because it shrinks more in the oven. Ground beef is 0.75. These are our own house conventions applied identically to both animals, not USDA figures: USDA’s published cooking yields measure only moisture and fat lost in the pan, so they run higher and are not interchangeable with a purchased-weight factor. (Same conventions as our US cheapest-protein ranking, which uses US BLS prices in USD — don’t mix the two currencies.)
| Cut | Price (CAD/kg) | $ per g of cooked protein | The math |
|---|---|---|---|
| Chicken drumstick | $7.29 | $0.062 | 7.29 ÷ (10 × 0.50 × 23.4) |
| Chicken breast | $14.58 | $0.065 | 14.58 ÷ (10 × 0.72 × 31.0) |
| Chicken thigh | $13.72 | $0.077 | 13.72 ÷ (10 × 0.72 × 24.8) |
| Ground beef (85%) | $16.07 | $0.083 | 16.07 ÷ (10 × 0.75 × 25.9) |
| Beef eye of round | $28.64 | $0.137 | 28.64 ÷ (10 × 0.70 × 29.9) |
| Beef top sirloin | $30.60 | $0.163 | 30.60 ÷ (10 × 0.70 × 26.8) |
| Beef ribeye (rib cuts avg.) | $31.14 | $0.194 | 31.14 ÷ (10 × 0.70 × 22.9) |
| Beef flank | $48.48 | $0.251 | 48.48 ÷ (10 × 0.70 × 27.6) |
Price caveats, stated plainly: StatCan’s “chicken breasts” and “chicken thigh” series don’t specify boneless — we assume boneless-skinless (consistent with the breast price); if the thigh series is bone-in, thigh protein cost rises to about $0.118/g. The ribeye row uses StatCan’s “beef rib cuts” family average, which may include bone-in cuts and roasts — treat it as a proxy. Eye of round and flank are provisional: single-retailer prices found by web search and never confirmed in a browser, not official statistics. A second retailer ran 9-15% higher on both (Real Canadian Superstore $33.05/kg eye of round, Atlantic Superstore $52.89/kg flank). Note which way that cuts — using the higher prices would make beef look worse, moving the cheapest-chicken-vs-cheapest-steak gap from 2.2x to about 2.5x, so these two rows are the charitable read for beef. Prices are a point in time; the rankings are far more stable than the absolute cents.
The headline: the cheapest chicken protein ($0.062/g, drumsticks) costs 2.2 to 2.6x less than the cheapest steak protein — $0.137/g for web-priced eye of round, $0.163/g for sirloin, the cheapest steak in the official StatCan series. On StatCan-only rows it’s breast $0.065 vs sirloin $0.163 — 2.5x. Even ground beef, the budget end of beef, can’t undercut a single chicken row — with one caveat we owe you: that holds on the boneless-thigh reading of StatCan’s series. If that series is bone-in, thigh protein costs about $0.118/g and ground beef slips past it.
And the flank twist is worth savoring: the as-sold steak that wins the protein-per-100g contest (27.6 g, ahead of sirloin’s 26.8 — trimmed lean-only cuts still beat it) loses the price contest outright at $0.251/g, the most expensive protein in this table. Butchers price flank for fajitas and demand, not for macros.
Drumstick protein: 6.2 cents a gram. Sirloin: 16.3 cents. Beef has to earn that gap somewhere other than protein.
What Does Steak Give You That Chicken Doesn’t?
Beef earns its premium in these three columns. Per 100 g cooked, from the same FDC entries:
| Cut | Iron | Zinc | B12 |
|---|---|---|---|
| Chicken breast | 1.04 mg | 1.00 mg | 0.34 µg |
| Chicken thigh (meat only) | 1.13 mg | 1.92 mg | 0.42 µg |
| Chicken drumstick (meat + skin) | 1.11 mg | 2.36 mg | 0.39 µg |
| Beef top sirloin (as sold) | 1.81 mg | 4.81 mg | 1.77 µg |
| Beef eye of round | 1.86 mg | 4.35 mg | 2.13 µg |
| Beef ribeye | 2.33 mg | 5.84 mg | 2.13 µg |
| Beef flank | 1.80 mg | 4.79 mg | 1.82 µg |
The gaps are not subtle:
- B12: beef runs 1.77-2.13 µg per 100 g against chicken’s 0.34-0.42 — 5 to 6x chicken breast, and at least 4x any chicken cut on the table.
- Zinc: beef’s 4.35-5.84 mg is roughly double chicken’s best cut (drumstick, 2.36 mg) and 4-6x breast.
- Iron: beef carries about 1.7-2.2x breast’s iron. Both animals supply heme iron — the form found in muscle tissue that your body absorbs far more readily than the non-heme iron in plants — so beef’s advantage over chicken is mostly more total iron, not a different kind of it. The heme-vs-non-heme gap is the one that matters when you’re comparing meat to beans or spinach, not beef to chicken. (USDA doesn’t split heme from non-heme, so we keep that part qualitative.)
Beef also carries meaningfully more creatine than chicken — the compound your muscles use for short, explosive efforts, and the reason “steak for strength” predates every supplement store. USDA doesn’t publish creatine values, so we won’t print a number we can’t source, but the direction is well established.
None of this makes chicken deficient — it makes the two cuts different tools. If your diet is light on red meat and your training is heavy, a couple of beef meals a week (say, the Korean Beef Bulgogi Bowl, 54.7 g protein) is the cheapest micronutrient insurance in the meat case.
Is Steak or Chicken Healthier?
On saturated fat, chicken wins — and the gap is wider than the protein gap. Beef fat runs 34-44% saturated against chicken’s 27-28%, so the difference compounds on top of beef’s higher total fat. Per 100 g cooked (USDA FDC, same entries as above):
| Cut | Saturated fat /100g | Total fat /100g |
|---|---|---|
| Chicken breast, skinless | 1.01 g | 3.57 g |
| Beef eye of round, lean only | 1.44 g | 4.26 g |
| Beef top sirloin, lean only | 2.20 g | 5.79 g |
| Chicken thigh, meat only | 2.31 g | 8.15 g |
| Chicken drumstick, meat + skin | 2.74 g | 10.2 g |
| Beef flank, as sold | 3.84 g | 9.31 g |
| Chicken thigh, meat + skin | 4.11 g | 14.7 g |
| Ground beef, 85% lean | 5.90 g | 15.4 g |
| Beef top sirloin, as sold | 6.20 g | 15.8 g |
| Beef ribeye, as sold | 10.3 g | 23.5 g |
Health Canada advises choosing lean cuts and skinless poultry and limiting saturated fat; the American Heart Association caps it at about 13 g a day on a 2,000-calorie diet. A 200 g serving of ribeye is 20.6 g — over that ceiling in one meal. The same serving of chicken breast is 2 g. Trimming closes most of the gap: lean-only eye of round (1.44 g) sits closer to breast than to ribeye.
Two things this section is not saying. First, fresh red meat is a different category from processed meat — IARC classifies processed meat (bacon, deli meat, hot dogs, sausage) as carcinogenic to humans, Group 1, and fresh red meat as Group 2A, “probably carcinogenic.” Nothing on this table is processed meat. Second, a couple of beef meals a week is not the same dietary pattern as beef daily, and the saturated-fat math above is per serving, not per diet. If you have been told to watch LDL cholesterol, the bigger lever is which cut you buy — eye of round over ribeye is a 7x swing in saturated fat — not which animal.
Is Steak or Chicken Better for Building Muscle?
For total protein per calorie, breast — with the scope from earlier: 1.4 to 2.5x any steak as sold, a rounding error over trimmed eye of round.
But muscle building has a second lever: leucine, the amino acid that most directly signals your muscles to start building after a meal. Here’s leucine per 100 g cooked (USDA SR Legacy amino-acid panels) and per 170 g (6 oz) serving — per-serving is simply the per-100g value × 1.7:
| Cut | Leucine /100g | Per 6 oz serving |
|---|---|---|
| Beef eye of round | 2.73 g | 4.64 g |
| Beef sirloin (lean only) | 2.43 g | 4.13 g |
| Chicken breast | 2.33 g | 3.96 g |
| Beef sirloin (as sold) | 2.23 g | 3.79 g |
| Beef flank | 2.19 g | 3.72 g |
| Chicken thigh (meat only) | 2.11 g | 3.59 g |
| Beef ribeye | 1.96 g | 3.33 g |
| Chicken drumstick (meat + skin) | 1.93 g | 3.28 g |
| Ground beef (85%) | 1.45 g | 2.47 g |
The useful takeaway: every cut on this table except ground beef clears about 3 g of leucine at a 6 oz serving — at or past the per-meal leucine thresholds commonly cited in sports-nutrition research. Eat a real portion of either animal and leucine is unlikely to be your limiting factor.
Worth flagging on the top row: eye of round’s 2.73 g means 9.1% of its protein is leucine, versus a typical ~8% for meat — that’s what USDA’s analytical panel reports (FDC 170634), but amino-acid panels are small-sample data, so don’t build a “beef leucine is superior” thesis on a single entry. The fair summary is that beef and chicken are leucine peers per serving, and breast remains the winner per calorie.
For high-protein meals that lean on each: Hainanese Chicken Rice delivers 60 g of protein from breast at 605 calories, and Crispy Air Fryer Chicken Thighs prove dark meat can carry a 60 g protein dinner too.
Steak or Chicken: Which Should You Buy?
The table settles into four buying rules:
- Cutting calories, want maximum protein: skinless breast, 18.8 g per 100 kcal. Nothing as sold comes close. (Deeper cut-by-cut chicken advice: Chicken Breast vs Thigh.)
- Cutting calories, want steak: eye of round or lean-only sirloin — 18.0 and 16.7 g per 100 kcal — and eye of round is the second-cheapest beef row at $0.137/g of protein.
- Feeding a budget: drumsticks ($0.062/g), breast ($0.065/g), thighs ($0.077/g), then ground beef ($0.083/g). Every chicken cut beats every beef cut on protein per dollar — assuming StatCan’s thigh series is boneless; if it’s bone-in, thigh ($0.118/g) drops behind ground beef.
- Chasing iron, zinc, B12, creatine — or just flavor: beef, deliberately. Buy ribeye because you want ribeye, knowing you’re paying $0.194/g for 7.6 g protein per 100 kcal, and enjoy it. The mistake isn’t buying fatty steak; it’s calling it a protein purchase.
The “chicken vs steak protein” framing hides the real spread: the distance from ribeye to eye of round (7.6 to 18.0 g per 100 kcal) is bigger than the distance from beef to chicken at any matched fat level. Pick the cut, not the animal. (For how beef stacks against pork, see Pork vs Beef; for the full protein-per-calorie leaderboard across all foods, see Protein Per Calorie, Ranked.)
The Bottom Line
Make chicken your default protein: drumsticks are the cheapest per gram ($0.062), and breast costs barely more ($0.065) while leading every cut here on protein per calorie. Add one or two beef meals a week for the B12, zinc, and iron chicken can’t match, and make that beef eye of round or trimmed sirloin if you’re watching calories (they land a hair behind breast) or saturated fat (1.4 g and 2.2 g per 100 g), ground beef if you’re watching dollars. Skip flank when the goal is value — it’s the most expensive protein on our table — and buy ribeye only on flavor’s budget, never protein’s.
Frequently Asked Questions
Does chicken breast have more protein than steak?
Yes, per 100 g cooked. Skinless chicken breast delivers 31.0 g of protein per 100 g, which beats every common steak cut as sold (22.9-27.6 g). Trim a steak to lean-only and the gap nearly closes: trimmed top sirloin reaches 30.6 g and eye of round 29.9 g. As eaten, breast keeps the crown.
What has more protein, 100g of chicken or 100g of beef?
Cooked skinless chicken breast has 31.0 g of protein per 100 g, versus 26.8 g for top sirloin as sold and 22.9 g for ribeye. Lean-only trimmed sirloin nearly ties breast at 30.6 g. Chicken thigh meat (24.8 g) and drumstick with skin (23.4 g) sit in the same range as the fattier steaks.
Why does ribeye have less protein than sirloin?
Fat displaces protein. Per 100 g cooked, ribeye carries 23.5 g of fat versus 15.8 g for top sirloin as sold, so ribeye’s protein drops to 22.9 g against sirloin’s 26.8 g. The fattier the cut, the less room per 100 g is left for protein.
Is chicken thigh protein comparable to steak?
Close. Chicken thigh meat delivers 24.8 g of protein per 100 g cooked, in the same territory as top sirloin as sold at 26.8 g — and it costs roughly half as much per gram of protein ($0.077 vs $0.163 CAD, May 2026 Statistics Canada prices).
Which is cheaper for protein, chicken or beef in Canada?
Chicken. The cheapest chicken protein (drumsticks, about $0.062 per gram of cooked protein) is 2.2 to 2.6x cheaper than the cheapest steak protein — eye of round at about $0.137 per gram (provisional single-retailer web price), top sirloin at about $0.163 (official StatCan data). Even ground beef, at about $0.083 per gram, cannot beat any chicken cut in our data, assuming StatCan’s thigh series is boneless (May 2026 prices).
Is steak or chicken healthier?
On saturated fat, chicken — and by a wider margin than on protein. Per 100 g cooked, skinless chicken breast has 1.01 g of saturated fat against 10.3 g for ribeye as sold and 6.2 g for top sirloin as sold; beef fat is 34-44% saturated versus chicken’s 27-28%. A 200 g ribeye serving delivers 20.6 g, past the American Heart Association’s roughly 13 g daily suggestion on a 2,000-calorie diet. The cut matters more than the animal: lean-only eye of round is 1.44 g, a 7x swing from ribeye. Beef still wins on iron, zinc, and B12, and none of these cuts is processed meat, which IARC classifies separately as Group 1.
How We Calculated This (Methodology)
Protein, calories, fat, micronutrients, and leucine come from USDA FoodData Central; every value was re-verified against the live FDC entry on July 12, 2026, and every table row carries its FDC ID. All values are cooked, as-eaten basis: “as sold” steaks use separable lean-and-fat entries at retail trim (choice grade), bone-in chicken uses meat-and-skin entries, and lean-only rows are the trimmed comparison. Cooked basis matters because water loss concentrates protein — raw numbers would understate every row.
Prices are Statistics Canada average retail prices for May 2026 (Table 18-10-0245-01, Canada average) for six of eight cuts; eye of round and flank use Metro.ca regular prices found by web search on July 12, 2026 and compared against a second Canadian retailer, but never browser-verified — we mark those two rows provisional. Cost per gram of protein applies purchased-weight-to-cooked-edible factors (boneless chicken 0.72, boneless beef 0.70, bone-in chicken 0.50, ground beef 0.75; the bone-in factor covers bone plus cooking loss) so you’re pricing the protein that reaches the plate, not the raw weight at the till. These factors are our own conventions, held identical across both animals; they are deliberately not USDA cooking yields, which measure only in-pan moisture and fat loss and so exclude bone and trimmed fat. Ground beef uses FDC 174032 (25.9 g protein per 100 g, broiled patty).
Limitations: eight cuts spanning the range, not a census; StatCan’s chicken series don’t specify boneless (we assume boneless-skinless — if the thigh series is bone-in, thigh cost rises to ~$0.118/g); the ribeye price is a “rib cuts” family average; prices move, rankings mostly don’t. A deterministic validator script (validate_steak_vs_chicken.py) recomputes every protein, per-calorie, and cost-per-gram figure here from the stored data and re-checks all ten FDC entries against live USDA, failing loudly on drift. What it does not do is independently verify the yield factors or the retail prices — those are documented assumptions, not validated facts, which is why the two provisional price rows are flagged as such above.
Featured Recipes
All 6 recipes from this article, ready to cook
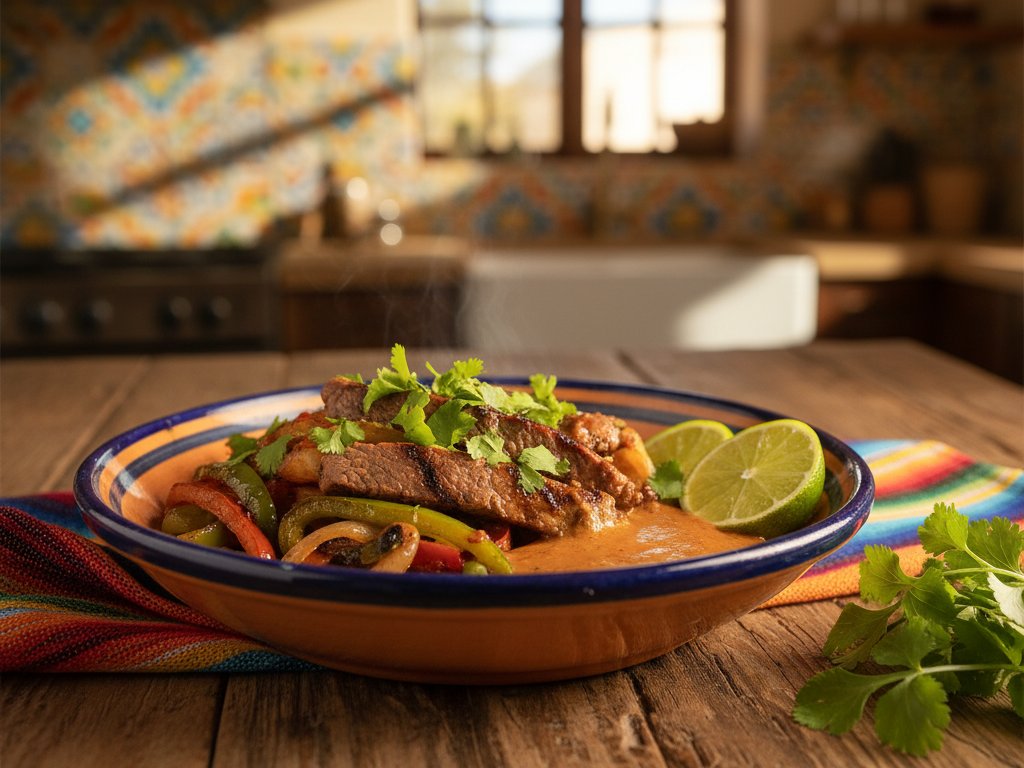
1. Steak Fajita Sheet Pan
Charred flank steak and sizzling peppers roast hands-off in 33 min. 47g protein, 590 cal per serving with Greek yogurt crema.
View Recipe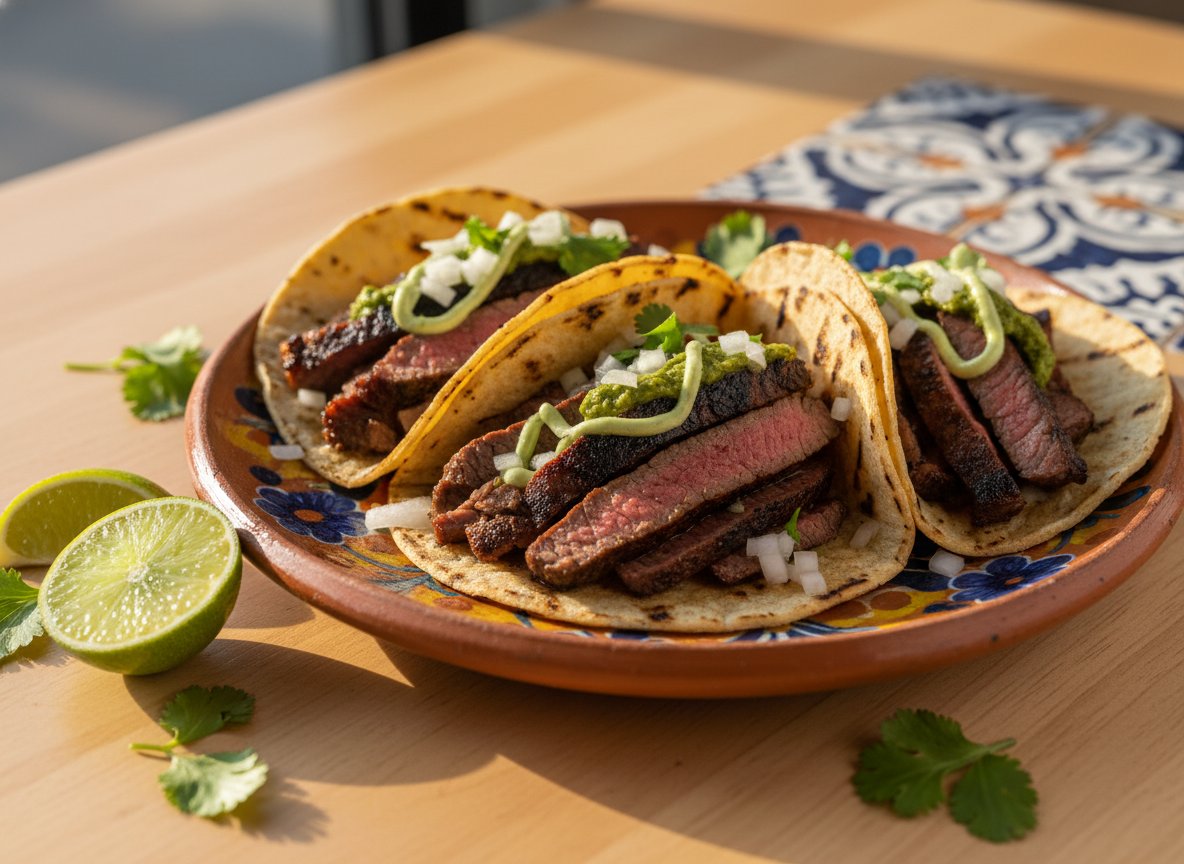
2. Steak Tacos with Chimichurri & Chili-Lime Crema
Seared flank steak tucked into warm tortillas with tangy lime crema and fresh chimichurri. 49g protein, 670 cal, ready in 35 min.
View Recipe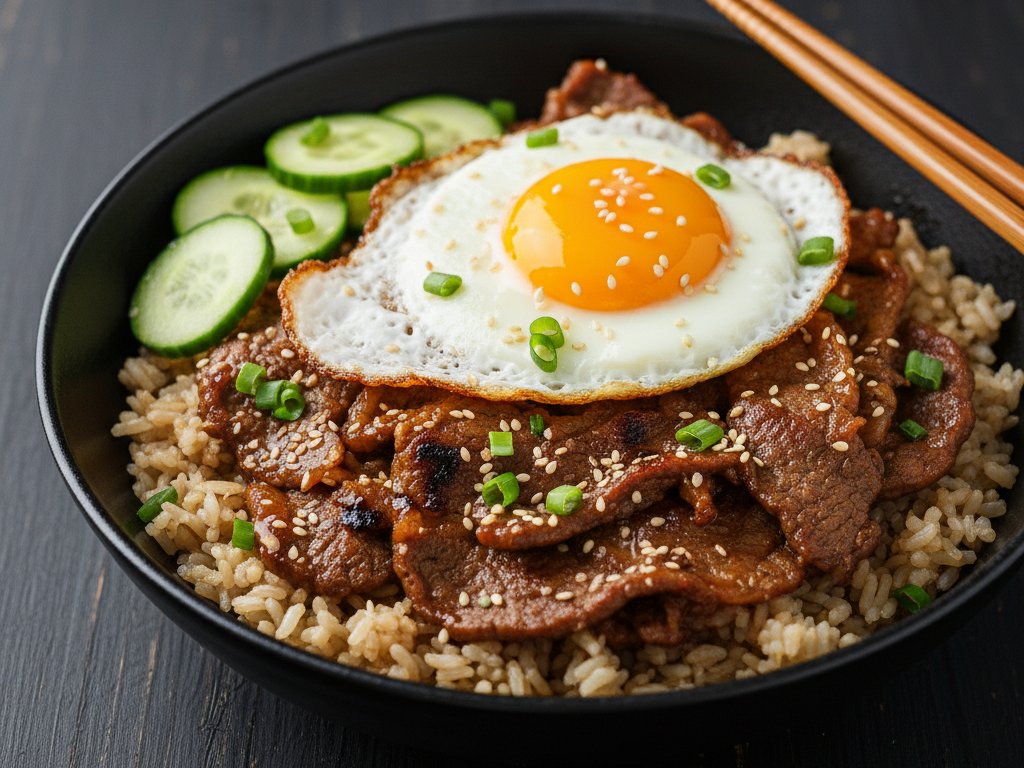
3. Korean Beef Bulgogi Bowl
Beef bulgogi bowl with thin-sliced Korean marinated beef over quinoa. 55g protein, 739 cal per serving — gochujang-sesame marinade, ready in 35 minutes.
View Recipe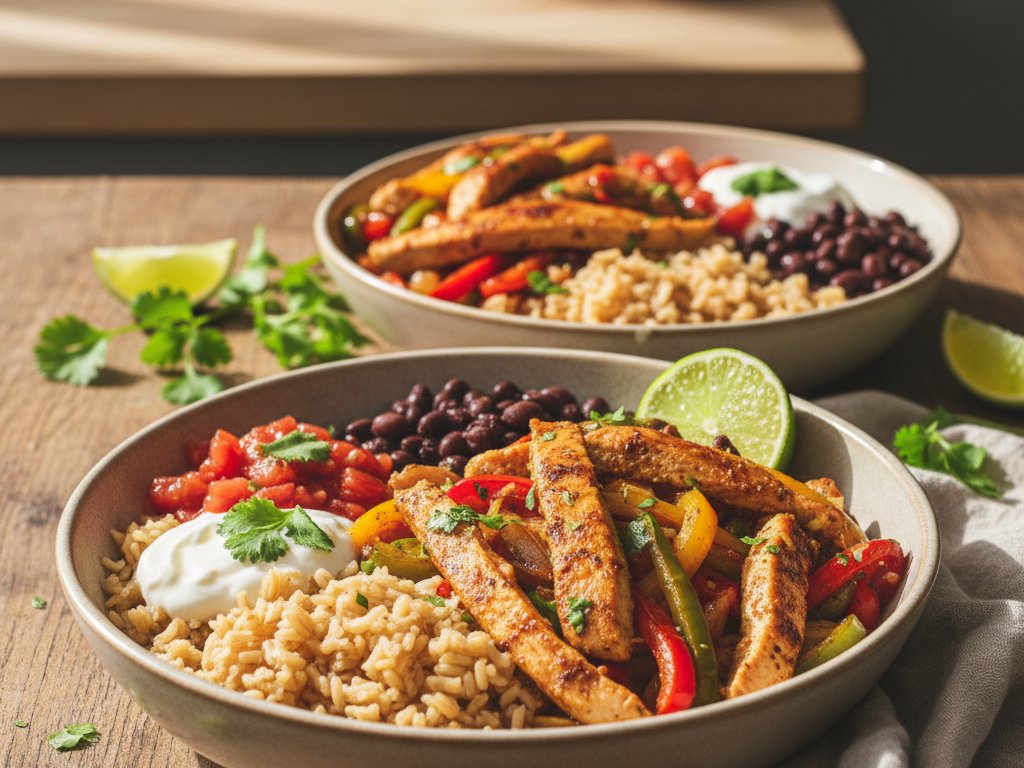
4. Skillet Chicken Fajita Bowls
Charred chicken and caramelized peppers over rice with smoky Tex-Mex spices. 37g protein, 546 cal, 55 min. One skillet, serious depth of flavor.
View Recipe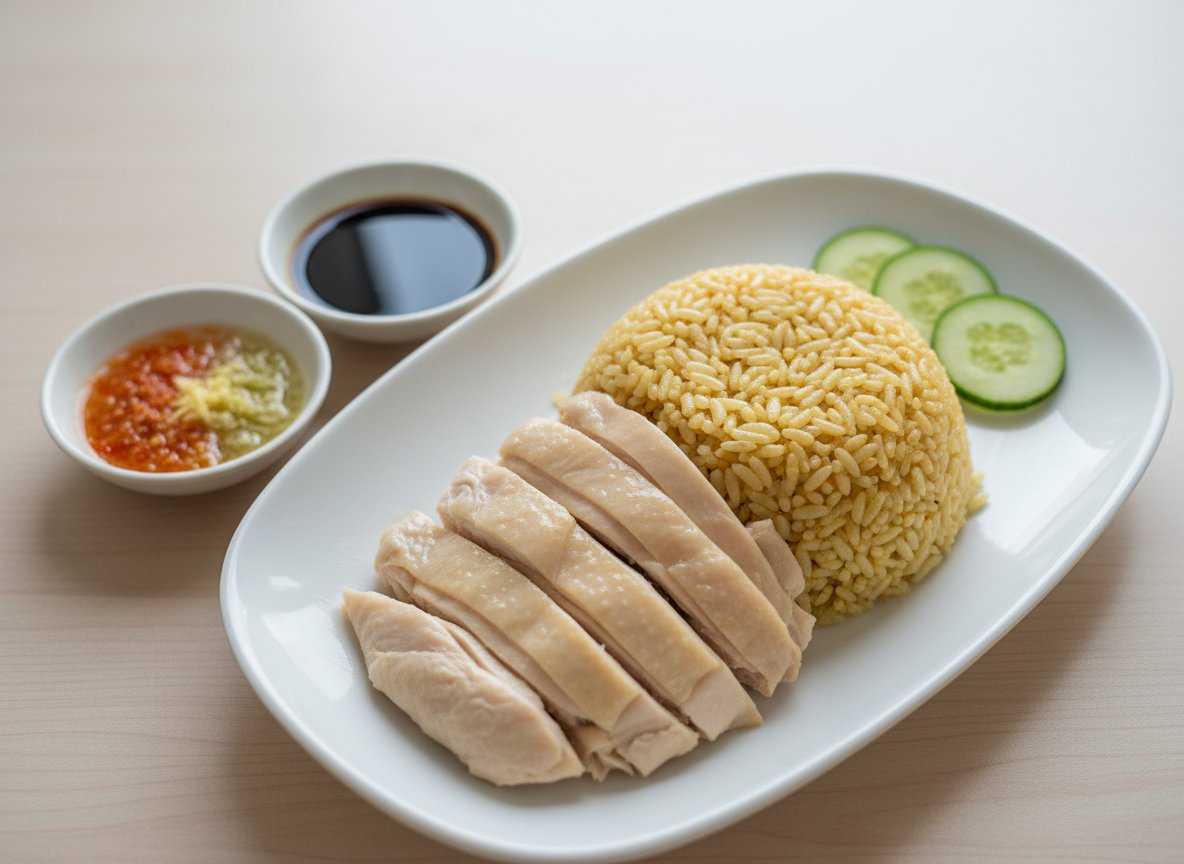
5. Hainanese Chicken Rice: 60g Protein, 605 Calories (Steam-Poach Method)
High-protein Hainanese Chicken Rice using steam-poach breast instead of whole chicken. 60g protein, 605 cal per serving. Ginger rice, chili sauce, 35 minutes.
View Recipe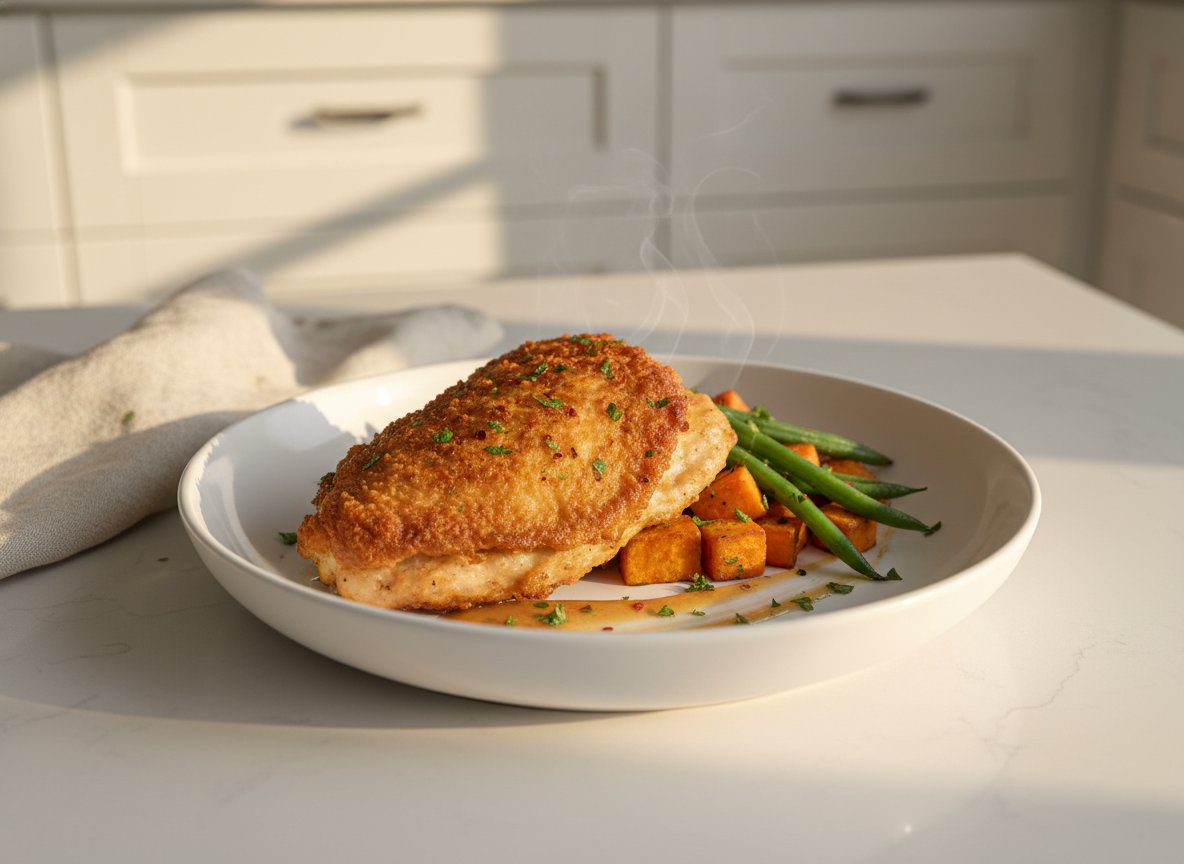
6. Crispy Air Fryer Chicken Thighs
Air fryer chicken thighs at 380°F in 35 min — crispy skin, juicy meat, 60g protein per serving. Simple smoked paprika spice rub, no deep-frying needed.
View Recipe