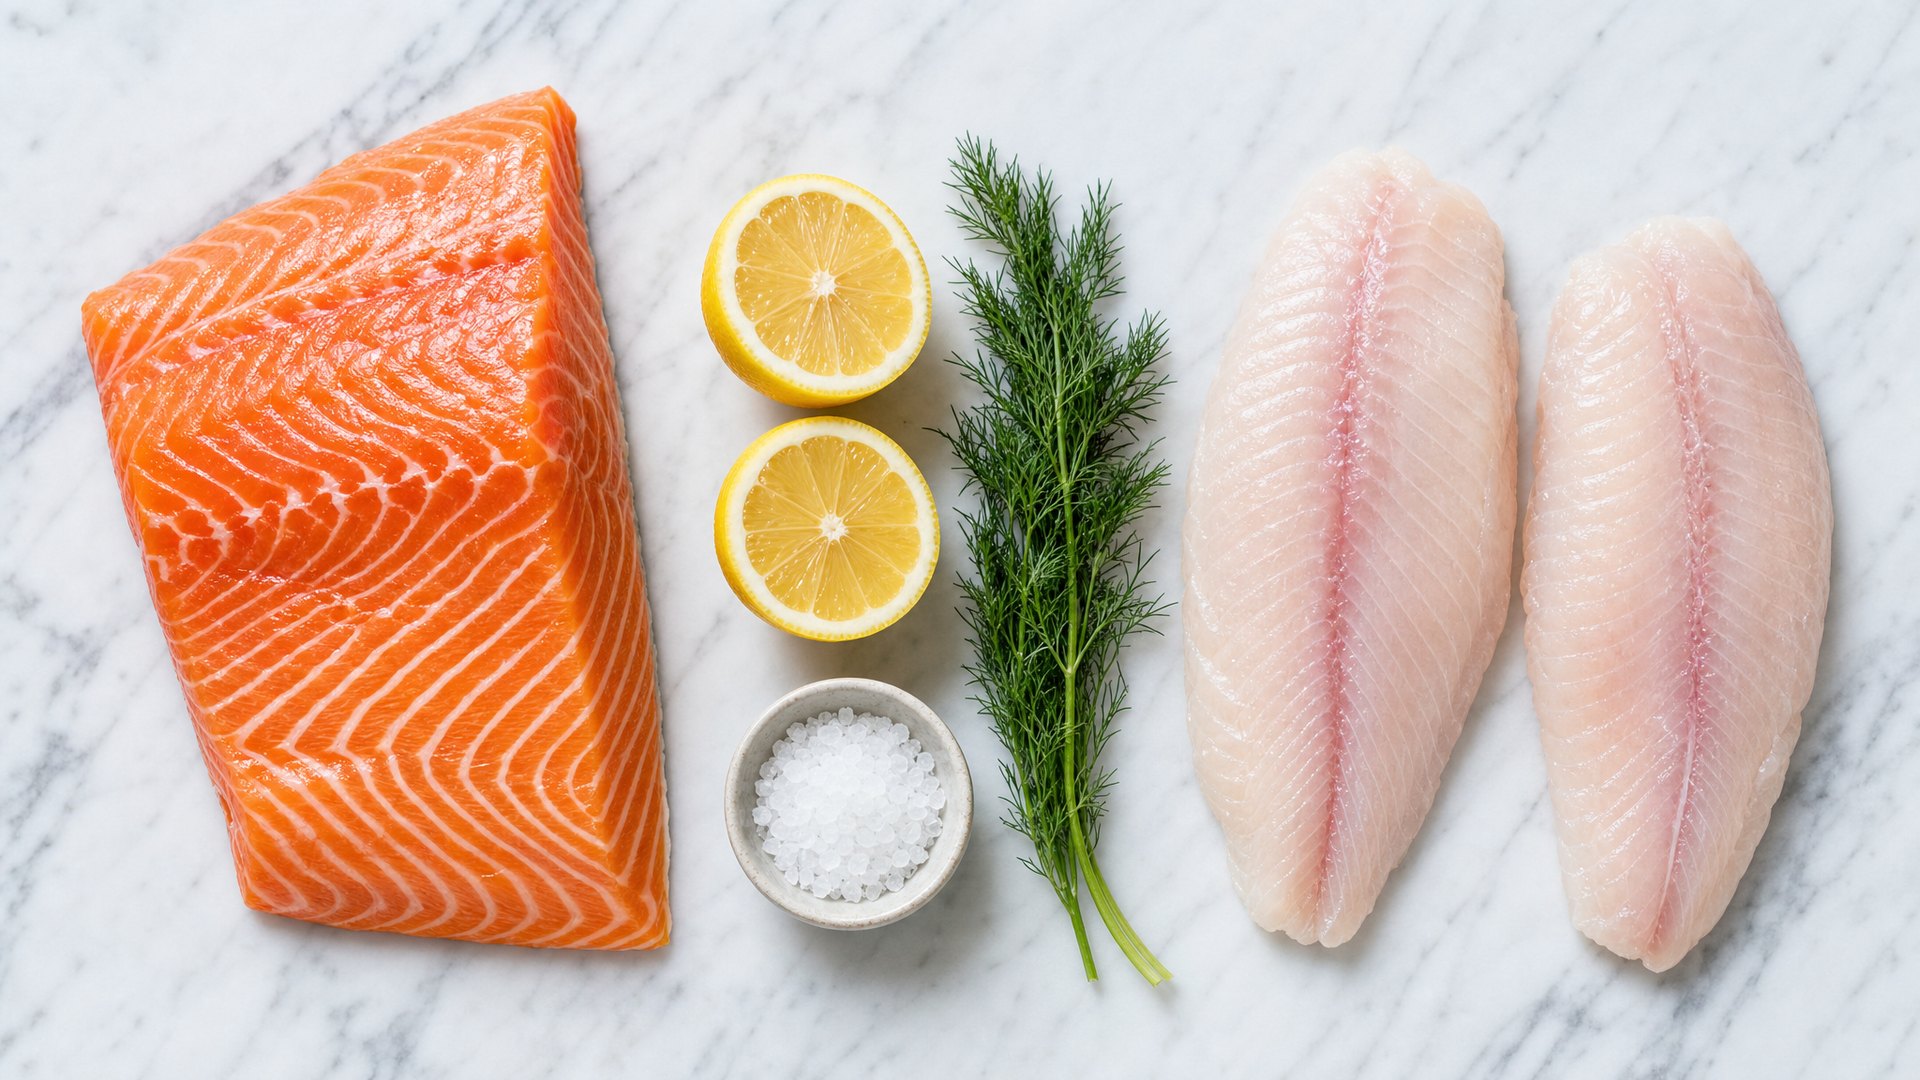
Salmon vs Tilapia: Protein, Price, and What You Actually Give Up
Raw fillet to raw fillet, the protein is a near-tie. Tilapia delivers 2-2.8x more protein per dollar at Canadian prices; salmon carries about 16x the omega-3. Full comparison with the math shown.
Part of The Protein Atlas — your complete guide to protein.
Raw fillet to raw fillet, tilapia and Atlantic salmon are a protein tie: 20.1 g vs 20.4 g per 100 g. What separates them is everything else. They’re two different purchases that happen to share a freezer case.
Tilapia wins protein per dollar. Salmon wins omega-3 per dollar. Pink salmon in a can does most of both.
Buy tilapia when protein per dollar is the goal: about 11 g of protein per dollar vs salmon’s 4.0-5.8. Buy salmon when omega-3 is the goal: roughly 16x the EPA+DHA, and about 10x cheaper per milligram of it. Want most of both on a budget? A $4.00 can of pink salmon delivers tilapia-level protein per dollar with salmon-family omega-3.
No other page on this matchup computes protein per dollar or cost per milligram of omega-3. This one does: Canadian dollars, every price dated, every calculation shown.
Does Salmon or Tilapia Have More Protein?
Neither, really. Per 100 g of raw fillet — the form you buy — tilapia has 20.1 g of protein and farmed Atlantic salmon has 20.4 g (USDA FoodData Central). A 0.3 g gap is a rounding error.
Other sites quote different numbers because they’re cooked values:
| Per 100 g, cooked (baked/broiled) | Protein | Calories | Fat |
|---|---|---|---|
| Tilapia | 26.15 g | 128 | 2.65 g |
| Atlantic salmon, farmed | 22.10 g | 206 | 12.35 g |
| Atlantic salmon, wild | 25.44 g | 182 | 8.13 g |
| Chicken breast (anchor) | 31.02 g | 165 | 3.57 g |
Source: USDA FoodData Central, cooked dry-heat entries (tilapia 175177, farmed Atlantic salmon 175168, wild Atlantic salmon 171998, chicken breast 171477).
Cooked, tilapia suddenly “wins” — 26.15 vs 22.10 g. That gap is water, not protein: lean tilapia loses more moisture in the pan, so what’s left is more concentrated, while salmon’s fat doesn’t evaporate. The protein in each fillet barely changed. The raw near-tie is the real comparison; the cooked divergence is concentration arithmetic, not extra nutrition.
One rule throughout: “salmon” is never one number. The farmed-wild fat gap (12.35 vs 8.13 g per 100 g cooked) drives most of the differences below, so the tables keep them split.
Is Salmon or Tilapia Cheaper in Canada?
In the tilapia vs salmon price matchup the tie ends fast — same store, same day, fresh Atlantic salmon costs more than double per kilogram:
| Item | Price | Per kg | Source |
|---|---|---|---|
| Seaquest tilapia fillets, frozen 1 kg club size | $17.00 | $17.00/kg | No Frills, Jul 2026 |
| Seaquest tilapia fillets, frozen 400 g | $7.00 | $17.50/kg | No Frills, Jul 2026 |
| Seaquest wild pink salmon fillets, frozen 400 g | $7.00 | $17.50/kg | No Frills, Jul 2026 |
| No Name wild Pacific pink salmon, canned 213 g | $4.00 | $1.88/100 g | No Frills, Jul 2026 |
| Atlantic salmon fillet, fresh 405 g | ~$16.00 | $39.50/kg | No Frills, Jul 2026 |
| Chicken breast, boneless club pack | — | $15.41/kg | No Frills, Jul 2026 |
| Salmon, national average | — | $27.25/kg | Statistics Canada, May 2026 |
| Chicken breast, national average | — | $16.02/kg | Statistics Canada, May 2026 |
| Canned salmon 213 g, national average | $5.20 | — | Statistics Canada, May 2026 |
About these prices: the store rows are one banner (No Frills), one Ontario store, checked July 2026. A snapshot, not gospel. The Statistics Canada rows are national average retail prices for May 2026, the durable anchor. StatCan’s $27.25/kg salmon average blends fresh and frozen formats, which is why it sits well under the $39.50/kg fresh counter.
The third row is the one to remember: frozen wild pink salmon costs exactly the same as frozen tilapia: $17.50/kg. Hold that thought.
Which Fish Gives You More Protein Per Dollar?
Price per kilogram isn’t the real answer either, because you buy fish raw and eat it cooked. Same method as our cheapest protein per gram ranking: 1 kg of raw boneless fillet cooks down to roughly 0.72 kg. That 0.72 is the site’s standard estimate, not a USDA constant, but the gaps below are wide enough that ±5% of yield changes no ranking.
The math, shown once in full for tilapia: $17.00 buys 1 kg raw → 0.72 kg cooked → 7.2 × 26.15 g = 188.3 g of cooked protein → 188.3 ÷ 17.00 = 11.1 g of protein per dollar.
| Food (price basis) | Price/kg raw | g protein per $ | $ per g protein |
|---|---|---|---|
| Chicken breast, club pack | $15.41 | 14.5 | $0.069 |
| Chicken breast (StatCan avg) | $16.02 | 13.9 | $0.072 |
| Tilapia, frozen 1 kg club | $17.00 | 11.1 | $0.090 |
| Tilapia, frozen 400 g | $17.50 | 10.8 | $0.093 |
| Canned pink salmon ($4.00/213 g can) | — | 10.5 | $0.095 |
| Wild pink salmon fillets, frozen | $17.50 | 10.1 | $0.099 |
| Canned pink salmon (StatCan $5.20/can) | — | 8.1 | $0.124 |
| Atlantic salmon (StatCan avg) | $27.25 | 5.8 | $0.171 |
| Atlantic salmon, fresh counter | $39.50 | 4.0 | $0.248 |
Canned salmon needs no yield factor — it’s ready to eat. Its 42.0 g per-can protein uses the USDA “total can contents” entry (19.7 g per 100 g × 213 g), liquid included, to avoid guessing at drained weight.
Three findings:
- Tilapia delivers roughly 2 to 2.8 times more protein per dollar than Atlantic salmon: 11.1 g/$ vs 5.8 at the national-average salmon price, or 4.0 at the fresh counter. This is the whole budget case for tilapia.
- Chicken breast still beats both. At $0.069 per gram of protein, the club pack is the cheapest thing in this table. Tilapia wins among the fish; chicken wins the table.
- Pink salmon — canned or frozen — lands at tilapia prices. 10.1-10.5 g of protein per dollar, within a few percent of tilapia’s 10.8-11.1. Same protein economics, several times the omega-3 (next section).
Is Tilapia Leaner Than Salmon?
Yes, dramatically — one of the clearest places tilapia genuinely outscores salmon rather than tying it. Per 100 calories of cooked fish:
| Food | g protein per 100 kcal | % of calories from protein |
|---|---|---|
| Tilapia | 20.4 | 82% |
| Chicken breast | 18.8 | 75% |
| Atlantic salmon, wild | 14.0 | 56% |
| Atlantic salmon, farmed | 10.7 | 43% |
(Shown math for tilapia: 26.15 g protein ÷ 1.28 hundred-calories = 20.4; protein share = 26.15 × 4 kcal ÷ 128 = 82%.)
Tilapia beats even chicken breast here. If you’re cutting, that’s real: a 40 g protein target costs about 196 calories of tilapia or about 373 of farmed salmon.
But say the quiet part out loud: “more protein per calorie” partly restates “less fat.” Salmon’s extra calories are its fat, and its fat is the EPA+DHA payload. Judging salmon by protein-per-calorie is scoring it on the thing you buy it for. Leanness is a real tilapia advantage when calories are tight; it is not evidence that salmon is a worse food.
One more tilapia point: protein has the highest thermic effect of any nutrient. Your body burns roughly 25-30% of protein’s calories just digesting it, versus 5-10% for carbs and 0-3% for fat, so a fish at 82% protein calories gets more of that discount. It’s why Lemon Herb Tilapia with Roasted Vegetables (42.9 g protein, 411 calories) ranks in the top quarter of our protein-per-calorie ranking.
What Do You Give Up by Choosing Tilapia?
Omega-3. Nearly all of it.
EPA and DHA are the two long-chain omega-3 fats: the ones tied to heart and brain benefits, and the reason the American Heart Association tells people to eat fatty fish twice a week. Your body makes very little of them; oily fish is the main food source. Here the two fish aren’t in the same league:
| Per 100 g cooked | EPA | DHA | EPA+DHA total |
|---|---|---|---|
| Atlantic salmon, farmed | 690 mg | 1,457 mg | 2,147 mg |
| Atlantic salmon, wild | 411 mg | 1,429 mg | 1,840 mg |
| Tilapia | 5 mg | 130 mg | 135 mg |
Farmed salmon carries 2,147 ÷ 135 = 15.9x (call it 16x) the EPA+DHA of tilapia. “An order of magnitude” is the arithmetic, not an exaggeration.
Concretely: against the 250 mg/day EPA+DHA intake the American Heart Association cites as the minimum for heart benefit, one 100 g serving of cooked farmed salmon (2,147 mg) covers about 8.6 days. Tilapia alone would take 250 ÷ 1.35 = 185 g every single day.
Notice the farmed row beats the wild row: farmed Atlantic salmon has more EPA+DHA than wild (2,147 vs 1,840 mg) because it’s fattier. If omega-3 is why you buy salmon, farmed isn’t the compromise; it’s the stronger pick. Wild’s edge is leanness: 25.44 vs 22.10 g protein and 182 vs 206 calories per 100 g cooked.
Now flip the per-dollar table and price the omega-3 instead:
- Farmed Atlantic salmon at StatCan’s $27.25/kg: ÷ 0.72 yield = $37.85/kg cooked → $3.78 per 100 g cooked → ÷ 2.147 = $1.76 per 1,000 mg of EPA+DHA.
- Tilapia at $17.00/kg: ÷ 0.72 = $23.61/kg cooked → $2.36 per 100 g cooked → ÷ 0.135 = $17.49 per 1,000 mg.
Salmon is about 10x cheaper per milligram of omega-3 (17.49 ÷ 1.76 = 9.9). That’s the entire decision framework in one sentence: tilapia is the cheap way to buy protein; salmon is the cheap way to buy omega-3.
The budget bridge: pink salmon
Canned pink salmon ($4.00 per 213 g can at No Frills) delivers 10.5 g of protein per dollar, nearly tied with tilapia. Its omega-3 sits on a different basis than that protein figure: USDA reports canned-fish omega-3 for drained solids rather than total can contents. Per 100 g drained, it carries 1,077 mg of EPA+DHA: roughly half of fresh farmed Atlantic’s 2,147, but about 8x tilapia’s 135 mg, at tilapia’s price. Frozen wild pink fillets ($17.50/kg) are the same species in fillet form and land lower: 617 mg per 100 g cooked, a bit over half the canned figure but still about 4.6x tilapia.
If canned salmon sounds grim: Air Fryer Canned Salmon Patties turn one can into dinner: 35 g protein, 290 calories a serving.
Which Has More Vitamins and Minerals?
Salmon wins two of the three that matter here; tilapia wins the third. ”% DV” = percent of the Daily Value, the reference intake on nutrition labels.
| Per 100 g cooked | Tilapia | Farmed Atl. salmon | Wild Atl. salmon |
|---|---|---|---|
| Vitamin B12 | 1.86 µg (78% DV) | 2.80 µg (117% DV) | 3.05 µg (127% DV) |
| Vitamin D | 150 IU / 3.75 µg (19% DV) | 526 IU / 13.2 µg (66% DV) | not reported |
| Selenium | 54.4 µg (99% DV) | 41.4 µg (75% DV) | 46.8 µg (85% DV) |
DV bases: B12 2.4 µg, vitamin D 20 µg, selenium 55 µg. The USDA’s wild-salmon entry doesn’t report vitamin D, so the table doesn’t invent one.
B12 (nerves, red blood cells): both are strong; a serving of either salmon clears a full day.
Vitamin D is the standout gap — few foods carry meaningful amounts, which matters at a Canadian latitude for half the year. Farmed salmon delivers 66% DV per 100 g; tilapia 19%.
Selenium (an antioxidant mineral your thyroid depends on) goes the other way: tilapia’s 99% DV per 100 g beats both types of salmon. Leaving that row out would be cherry-picking: tilapia is a genuinely excellent selenium source.
Is Tilapia Cheaper Than Chicken?
Chicken beats tilapia on price, by a little.
Per kilogram, boneless-skinless chicken breast in a club pack ran $15.41/kg at No Frills in July 2026 (Statistics Canada’s national average: $16.02/kg) vs $17.00/kg for the best tilapia price. Per gram of protein (the fairer test, after cooked-yield correction), chicken wins $0.069 to tilapia’s $0.090. The chicken row deliberately uses the cheapest widely available format; pricing tilapia against small-pack branded chicken would flatter the fish dishonestly.
So: chicken is cheaper than tilapia, tilapia is the cheapest widely available fish fillet, and no fish here beats chicken on protein per dollar. Salmon is much pricier than chicken: $27.25 vs $16.02/kg on national averages, about 1.7x per kilogram and roughly 2.5x per gram of protein ($0.171 vs $0.069-0.072).
Is fish cheaper than chicken overall, then? No: even tilapia, the cheapest fillet in the freezer case, runs about 10% more per kilogram than club-pack chicken breast.
The fish still earn their place: omega-3 (salmon), vitamin D (salmon), selenium (tilapia), and not eating chicken five nights a week.
So Which Should You Buy?
Buy tilapia if: you’re buying protein. It ties salmon on raw protein, beats it 2-2.8x on protein per dollar, and beats everything here — chicken included — on protein per calorie.
Buy salmon if: you’re buying omega-3, vitamin D, or B12. It carries about 16x tilapia’s EPA+DHA and costs about 10x less per milligram of it. Farmed is fine — it has more omega-3 than wild, not less.
Buy pink salmon (canned or frozen) if: you want both on a budget. Tilapia-level protein per dollar; about 8x tilapia’s omega-3 from the can, about 4.6x from frozen fillets.
Buy cod if: you want a mild white fish but tilapia puts you off — try Honey Garlic Glazed Cod (39.9 g protein, 415 calories).
Both are valid answers to different questions. A protein-first week leans tilapia: at a 200 g raw portion per plate, the 1 kg club bag covers five dinners. An omega-3-first week leans salmon: Teriyaki Salmon Sheet Pan (42 g protein, 485 calories, 25 minutes) on a weeknight, Garlic Butter Salmon with Asparagus (52.0 g protein, 742 calories) when it’s worth the counter price, or Salmon Rice Broccoli Meal Prep (44.0 g protein a serving, four servings in 30 minutes).
The Bottom Line
One 1 kg club bag of frozen tilapia ($17.00) for weekday protein, one 213 g can of pink salmon ($4.00) for the omega-3 gap. About $21 covers both jobs. If it’s a salmon week instead, buy it for the omega-3 and don’t feel bad about the calories — the fat is what you’re paying for.
Prices were checked July 2026 (No Frills, Ontario) against Statistics Canada May 2026 national averages; prices drift, and the rankings are far more stable than the dollar figures.
Frequently Asked Questions
Is tilapia cheaper than chicken in Canada?
No, not quite. Frozen tilapia fillets run about $17.00/kg vs about $15.41/kg for club-pack chicken breast (No Frills, July 2026), and chicken wins per gram of protein ($0.069 vs $0.090). Tilapia is the cheapest widely available fish fillet, though.
Does tilapia have any omega-3?
Barely: 135 mg of EPA+DHA per 100 g cooked, about one-sixteenth of farmed Atlantic salmon’s 2,147 mg. Hitting the 250 mg/day heart-health anchor from tilapia alone would take 185 g of cooked tilapia every single day.
Is farmed salmon worse than wild for omega-3?
No — farmed Atlantic salmon has more EPA+DHA than wild (2,147 vs 1,840 mg per 100 g cooked) because it is fattier. Wild has more protein per 100 g cooked (25.44 vs 22.10 g) and fewer calories (182 vs 206).
Is canned salmon as good as fresh?
For protein per dollar, yes: about 10.5 g per dollar ($4.00 per 213 g can, No Frills) vs 4.0-5.8 g per dollar for fresh Atlantic salmon (counter price to national average). Per 100 g drained, canned pink salmon has roughly half farmed Atlantic’s omega-3 (1,077 vs 2,147 mg EPA+DHA) — still about 8x tilapia.
Which is healthier, salmon or tilapia?
Depends on the job. Protein is nearly identical raw (20.1 vs 20.4 g per 100 g). Tilapia is leaner (128 vs 206 calories per 100 g cooked) and higher in selenium; salmon is far ahead on omega-3, vitamin B12, and vitamin D.
Is salmon more expensive than chicken?
Yes: $27.25/kg national average vs $16.02/kg for chicken breast (Statistics Canada, May 2026) — about 1.7x per kilogram, and roughly 2.5x per gram of protein.
- Tuna vs Salmon: Protein, Price, and Which to Actually Buy — the same farmed Atlantic numbers, matched against canned and fresh tuna on protein-per-calorie, omega-3, and cost.
- The Cheapest Protein Per Gram: 52 Foods Ranked — the methodology this article’s per-dollar math comes from.
Featured Recipes
All 6 recipes from this article, ready to cook
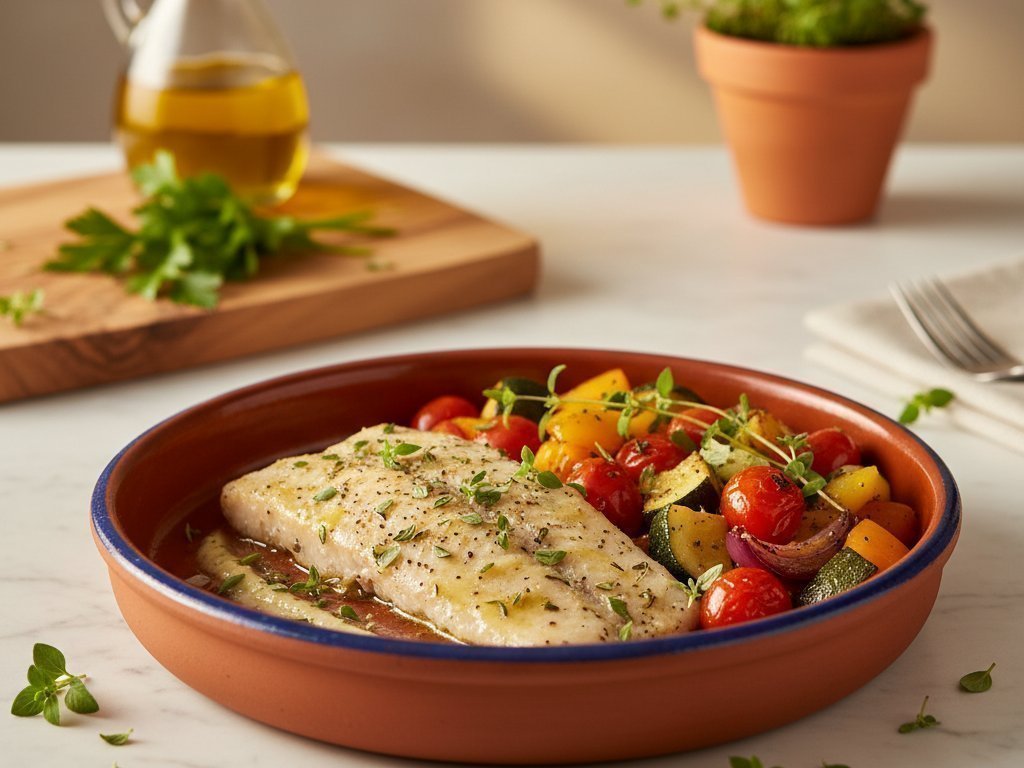
1. Lemon Herb Tilapia with Roasted Vegetables
Flaky tilapia roasted with bright lemon and colorful vegetables. 43g protein, 411 cal in 45 min. One pan, minimal cleanup.
View Recipe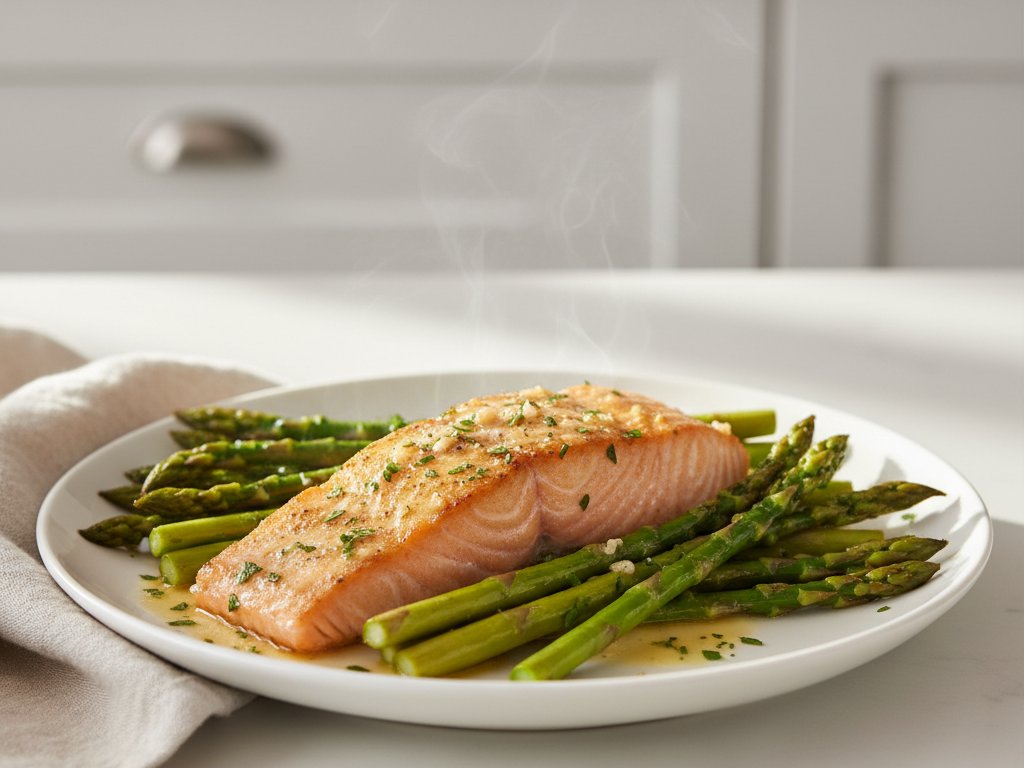
2. Garlic Butter Salmon and Asparagus Sheet Pan Meal
Buttery garlic-lemon glaze coats flaky salmon and tender asparagus. 52g protein, 742 cal. One pan, minimal cleanup, maximum omega-3s.
View Recipe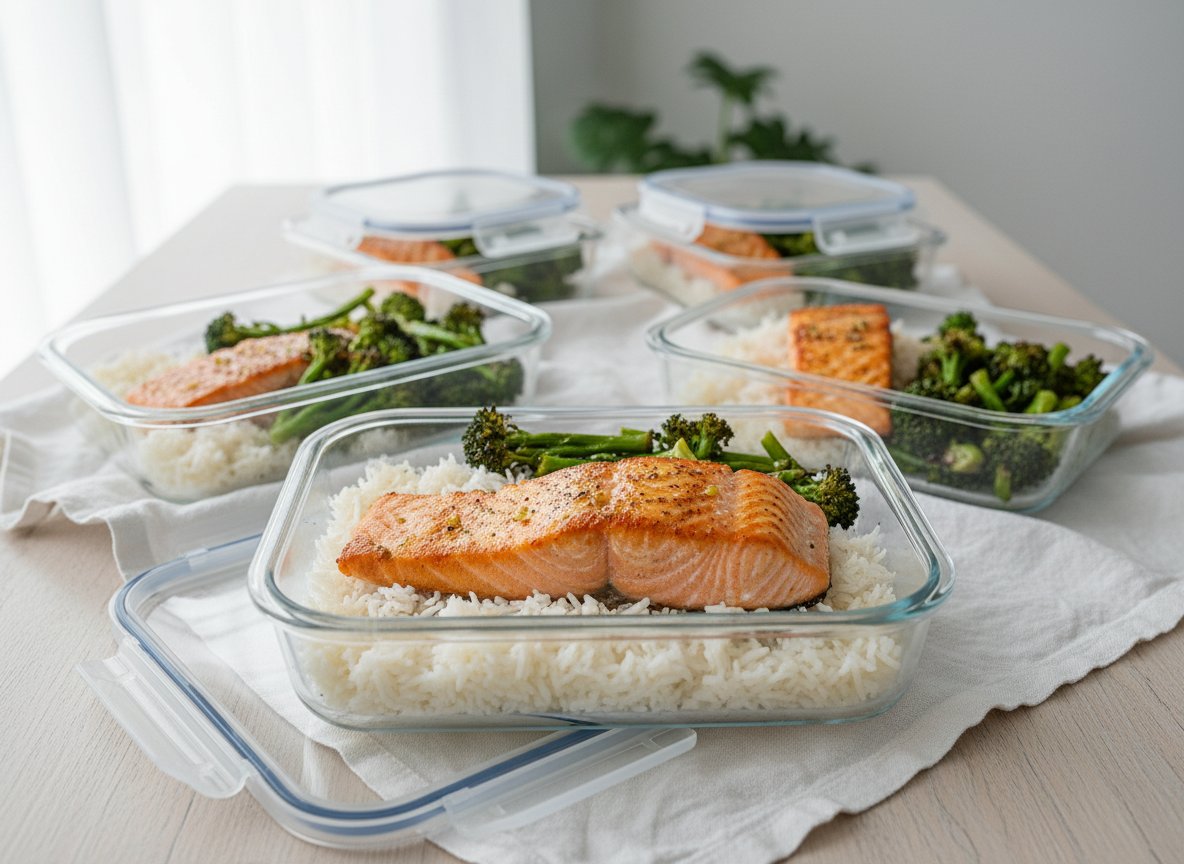
3. Salmon Rice and Broccoli Meal Prep - 44g Protein per Bowl
4 baked salmon bowls with jasmine rice and broccoli. 44g protein, 722 calories each. 30-minute prep with USDA-verified nutrition and 4 flavor variations.
View Recipe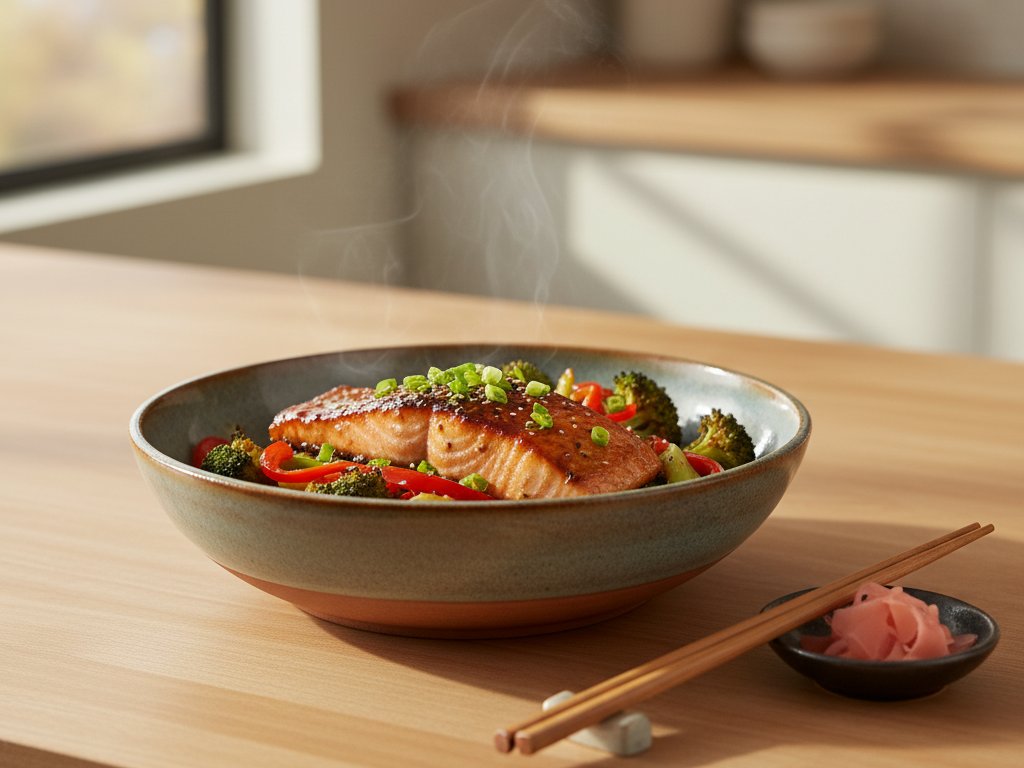
4. Teriyaki Salmon Sheet Pan
Glazed salmon roasts with broccoli and snap peas in sticky-sweet teriyaki sauce. 42g protein, 485 cal, meal prep ready.
View Recipe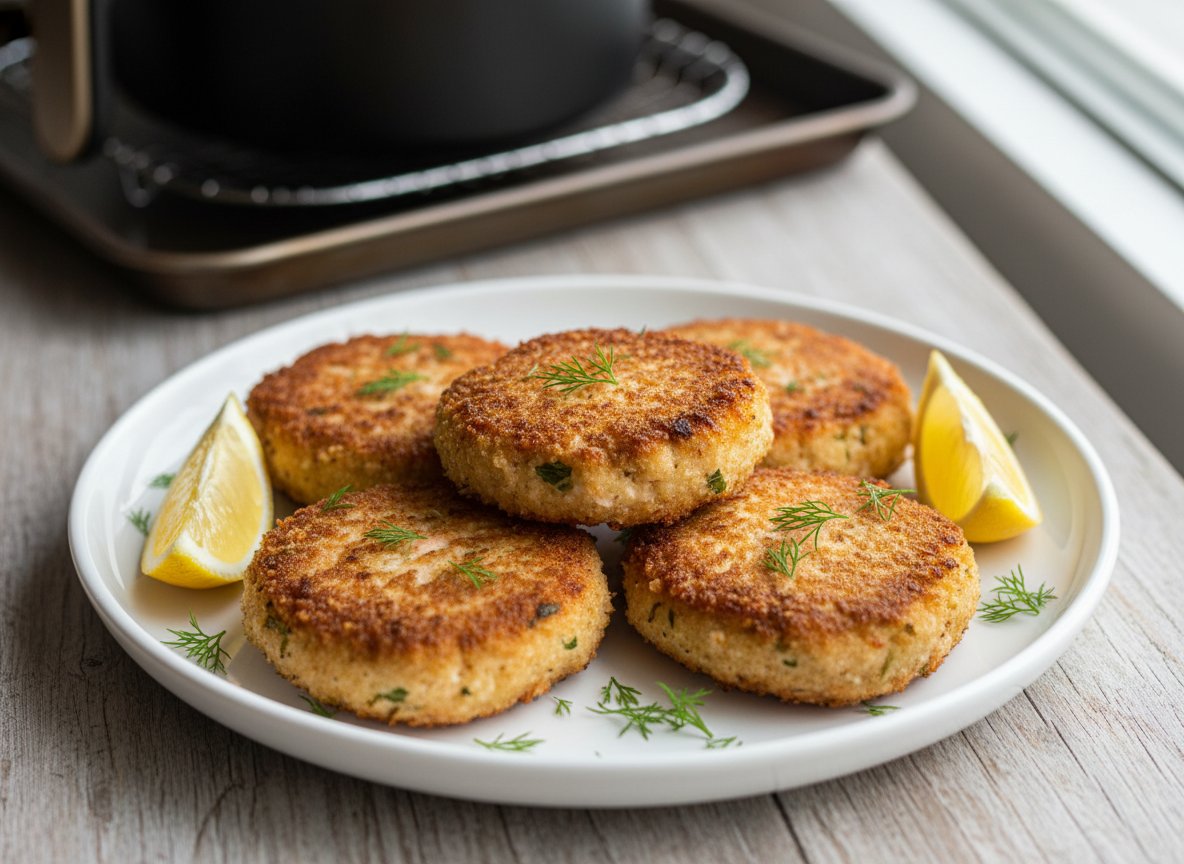
5. Air Fryer Canned Salmon Patties - 35g Protein, 20 Minutes
Crispy canned salmon patties in the air fryer. 35g protein, 290 calories per serving. One 14.75oz can, 20 minutes, 6 patties. USDA-verified nutrition.
View Recipe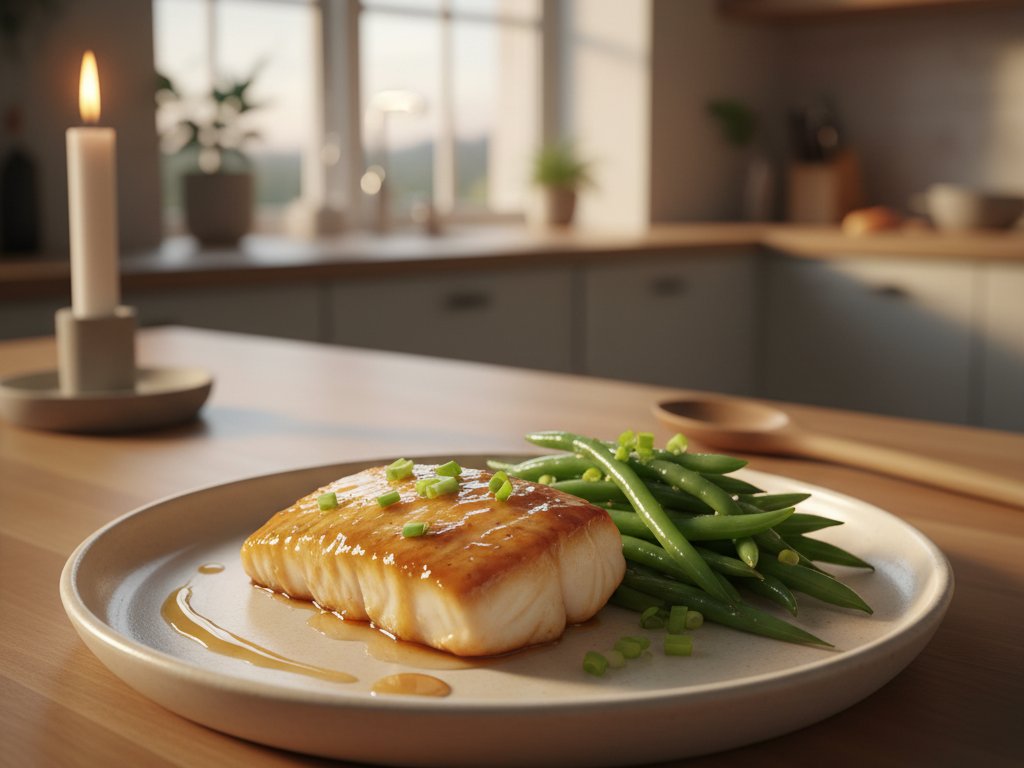
6. Honey Garlic Glazed Cod
Buttery, flaky cod fillets coated in sticky-sweet honey garlic glaze with tender green beans. 40g protein, 415 cal, 45 min sheet pan dinner.
View Recipe