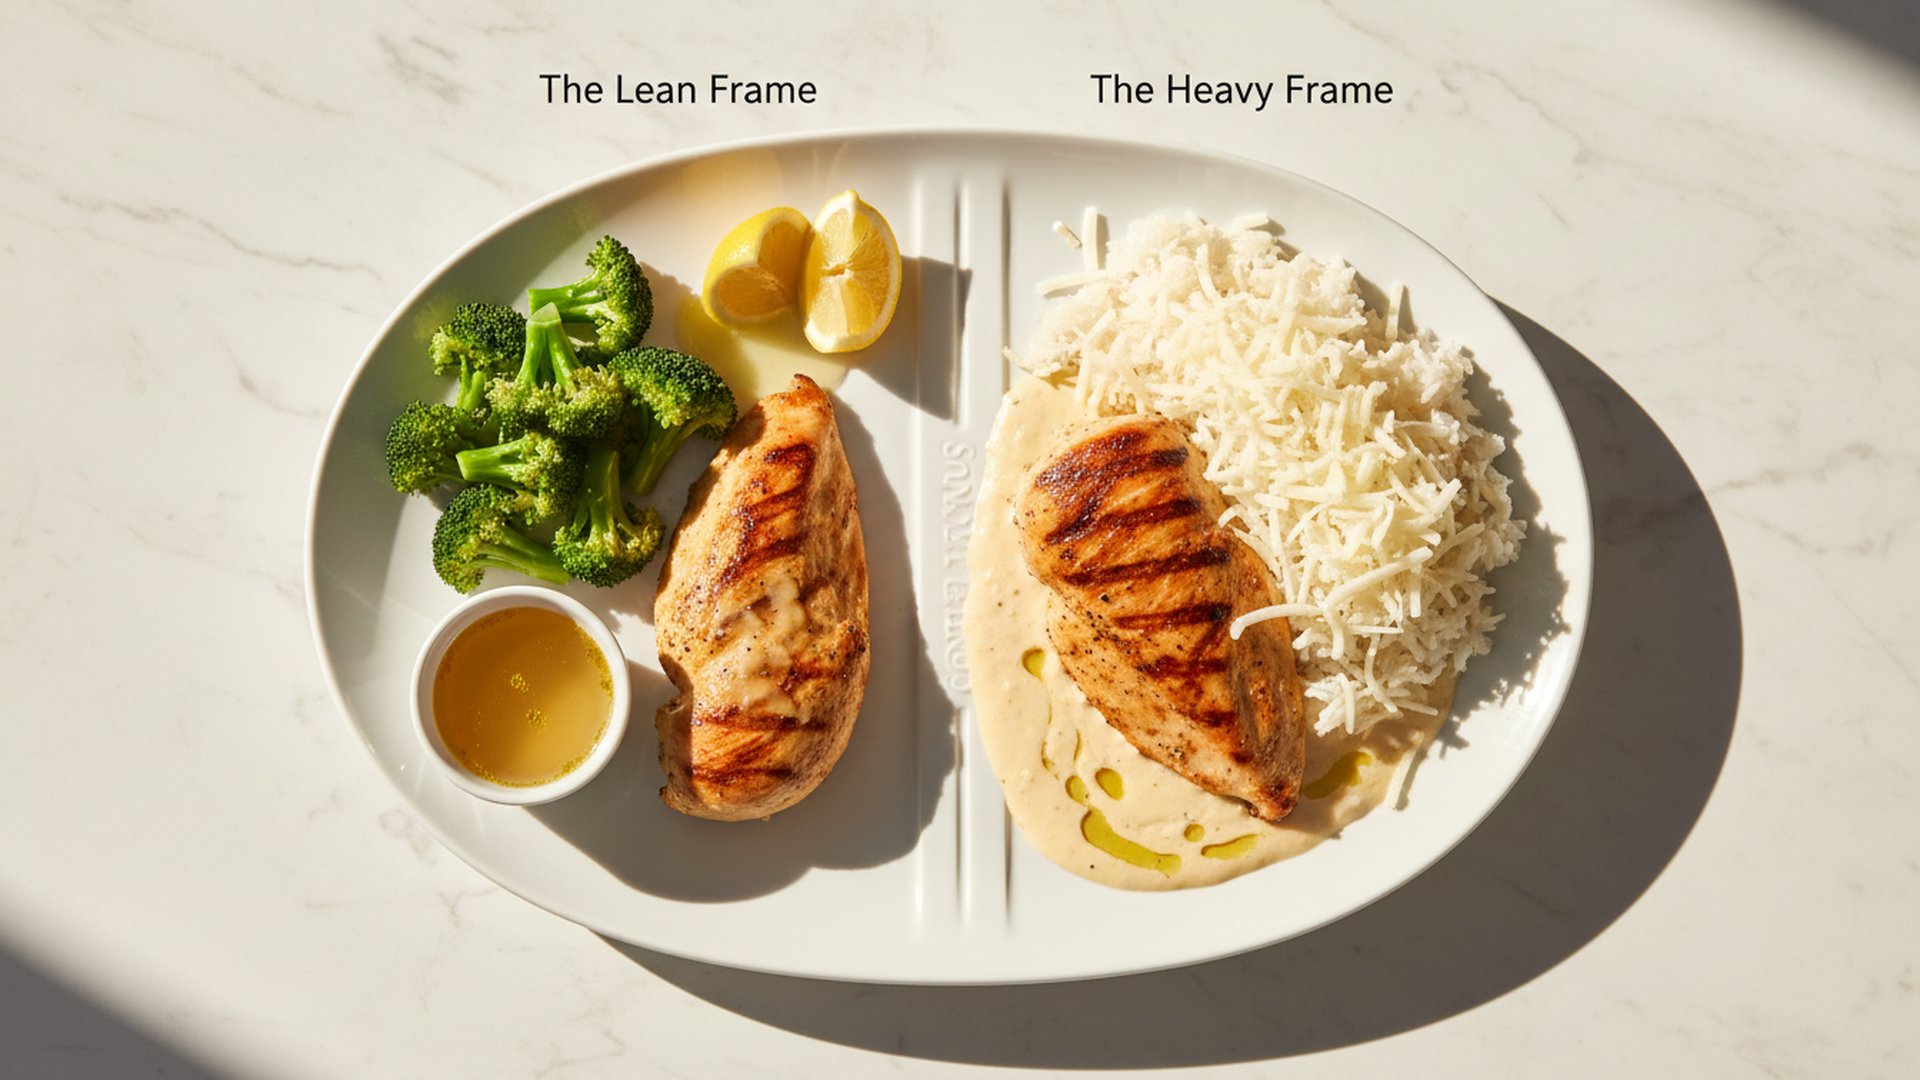
Why Your High-Protein Meals Have So Many Calories
We analyzed 133 recipes. Fat is twice as punishing per gram as carbs — but the internet blames carbs. Here's what actually drives protein-to-calorie ratio.
Part of The Protein Atlas — your complete guide to protein.
Egg White Cottage Cheese Bites: 24g protein, 124 calories. Spicy Black Bean Tacos: 30g protein, 658 calories.
The tacos have more protein. They also have 5x the calories. Their protein-to-calorie ratio: 4.6g per 100 cal. The bites: 19.6. Same website, same “high-protein” label, 4.3x efficiency gap.
(Fair caveat: the bites are a 124-calorie snack; the tacos are a 658-calorie dinner with 12g fiber and a full serving of plant protein. The tacos are a great meal by every metric except this one. But the gap is real, and understanding it is the point.)
We analyzed all 133 recipes to find out why. The answer wasn’t what fitness culture told us it would be.
Across 133 high-protein recipes, the total non-protein load — everything from carbs, fat, oil, and sauce that isn’t protein — explains 69% of the variation in protein efficiency. Fat is twice as punishing per gram as carbs: each gram of fat drops efficiency 0.105 points versus 0.052 for carbs, because fat carries 9 calories per gram vs. 4 for carbs or protein. Cooking method and recipe complexity explain far less — the frame you build around your protein determines most of the outcome.
We thought it was carbs. The data said: it’s everything that isn’t protein. And fat is worse than carbs.
TL;DR: Fat is twice as punishing per gram as carbs for protein efficiency — but the internet blames carbs because the carb differences are more visible on a plate. What actually drives your protein-to-calorie ratio is the total non-protein load: everything you build around the protein. Cooking method and recipe complexity barely matter. It’s the frame, not the protein.
These five deliver 50g+ protein AND 10g+ efficiency — skip the analysis and start cooking:
| Recipe | Protein | Cal | Efficiency |
|---|---|---|---|
| Chicken Noodle Soup | 50g | 387 | 13.0 |
| Lemon Herb Chicken Meal Prep | 66g | 576 | 11.4 |
| Shrimp Tacos with Lime Crema | 54g | 477 | 11.3 |
| Cajun Shrimp & Cauliflower Rice | 53g | 492 | 10.8 |
| Crispy Gochujang Chicken Breast | 54g | 507 | 10.7 |
Want to understand why these work and others don’t? Keep reading.
For Reference: How Normal Meals Score
Throughout this article, we use one metric: protein efficiency — grams of protein per 100 calories. Higher means more protein for fewer calories. A score of 10 means you get 10g of protein for every 100 calories. Simple.
For scale: a plain chicken breast scores about 19. A Big Mac scores 4.3. Most home-cooked meals land somewhere between 6 and 12.
Here’s what that looks like outside of a protein-optimized kitchen:
| Meal | Calories | Protein | Efficiency |
|---|---|---|---|
| Kraft Mac & Cheese | 350 | 9g | 2.6 |
| PB&J on White Bread | 370 | 12g | 3.2 |
| Pepperoni Pizza (2 slices) | 570 | 24g | 4.2 |
| Big Mac | 580 | 25g | 4.3 |
| Our lowest-efficiency recipe (kung pao seitan — still a great meal) | 481 | 21g | 4.4 |
| Our average (133 recipes) | 507 | 40g | 8.3 |
| Our best (egg white bites) | 124 | 24g | 19.6 |
Nutrition data: USDA FoodData Central, McDonald’s published nutrition facts.
A typical North American meal scores 3–4. Our lowest-efficiency recipe barely beats a Big Mac. Our average is 2x better. The question this article answers: what separates 4.4 from 19.6 within a protein-focused kitchen? The calorie math points to an obvious culprit — but it’s not the one fitness culture blames. (Want to skip the analysis? The five recipes that solve both problems are near the end.)
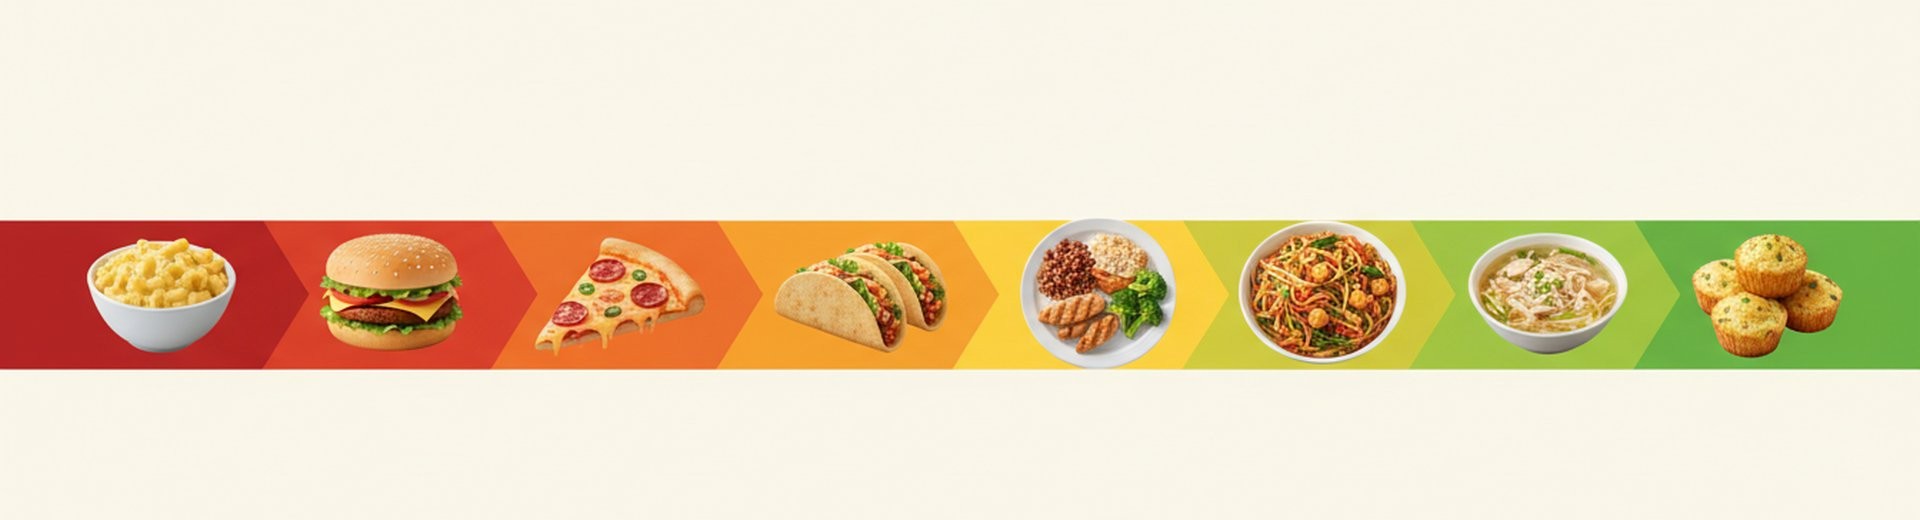
The Calorie Math You Need
Before the data, one fact explains almost everything that follows:
- Protein: 4 calories per gram
- Carbs: 4 calories per gram
- Fat: 9 calories per gram
Fat carries more than double the calories of protein or carbs, gram for gram. Every calorie that isn’t protein dilutes the ratio — but fat dilutes it twice as fast.
A recipe with 50g protein and 100 non-protein calories scores 16.7. Add 400 more non-protein calories — rice, sauce, oil — and it drops to 7.1. Same protein. Different frame.
One more thing the 4/4/9 numbers don’t capture: your body burns about 25–30% of protein calories just digesting it (the thermic effect), compared to 5–10% for carbs and 0–3% for fat. A 500-calorie meal with 50% protein costs your body more energy to process than the same calories from fat or carbs. This doesn’t change the ratios in our analysis — we use label calories, not net — but it means high-efficiency meals have an additional metabolic advantage that doesn’t show up in the numbers.
We Ran the Numbers on Everything
We tested every variable we could measure against protein efficiency across all 133 recipes:
| Factor | How Much It Explains |
|---|---|
| Non-protein calories (carbs + fat combined) | 69% of the gap |
| Total calories | 48% |
| Carbs alone | 30% |
| Fat alone | 27% |
| Ingredient count | 21% |
133 recipes, all differences statistically significant.
One factor dominates: non-protein calories — everything from carbs, fat, oil, and sauce that isn’t protein. Carbs alone explain 30%. Fat alone explains 27%. Neither tells the full story. The total non-protein load does.
An honest note about that 69%. Efficiency is calculated from calories, and non-protein calories are part of the formula — so some of that correlation is baked into the math. When we separate just the fat and carb grams (which aren’t in the formula), they independently explain about 46% of the efficiency variation. That’s the real predictive power: knowing only the grams of fat and carbs in a recipe gets you 46% of the way to predicting its efficiency score. The rest comes from things like which protein source you chose and how those macros interact. The 69% headline is real, but the 46% is the more honest number — and it still means that the frame you build around your protein is the single strongest lever you can pull.
Fat vs. Carbs: The Real Surprise Isn’t the Math
The 4/4/9 rule predicts that fat should hurt the ratio more than carbs. It does. When we ran a regression to separate the effects, each gram of fat drops efficiency twice as fast as a gram of carbs:
Efficiency = 12.48 − 0.052 × carbs(g) − 0.105 × fat(g)
In plain English: every gram of fat costs 0.105 points. Every gram of carbs costs 0.052. Fat is twice as punishing. Given that fat has 2.25x the calories per gram, this is exactly what you’d expect.
So why does the internet blame carbs? That’s the actual surprise. Fat is the stronger force — but carbs is the louder signal. Bottom 10 recipes: 27–93g carbs. Top 10: 2–24g. That swing is visible on any plate. Fat ranges less dramatically (16–34g in the bottom 10), so it’s easier to miss. People blame what they can see.
Swapped rice for an extra tablespoon of olive oil thinking “at least it’s not carbs”? One tablespoon of oil: 120 calories, zero protein. One cup of rice: 200 calories, 4g protein. Neither is great for the ratio, but oil is worse.
Both matter. The honest answer: watch the total non-protein load. Stop picking one villain.
The Egg Proof
Nothing demonstrates “same protein, different frame” better than eggs.
Seventeen egg recipes. 14.3-point efficiency spread — the widest of any ingredient on the site. Six examples spanning the range:
| Recipe | What’s Around the Eggs | Efficiency |
|---|---|---|
| Egg White Cottage Cheese Bites | Cottage cheese (lean dairy) | 19.60 |
| Spinach Feta Egg White Frittata | Vegetables, feta | 14.03 |
| Banana Egg Protein Pancakes | Banana, protein powder | 12.25 |
| Egg White Veggie Stir-Fry | Vegetables, soy sauce, oil | 9.44 |
| Korean Steamed Eggs | Broth, sesame oil | 7.63 |
| Turkish Menemen Scrambled Eggs | Peppers, tomatoes, oil | 6.58 |
Top of the table: egg whites paired with cottage cheese — almost zero non-protein calories. Bottom of the table: whole eggs swimming in oil-sauteed vegetables. The eggs didn’t get worse. The frame got heavier.
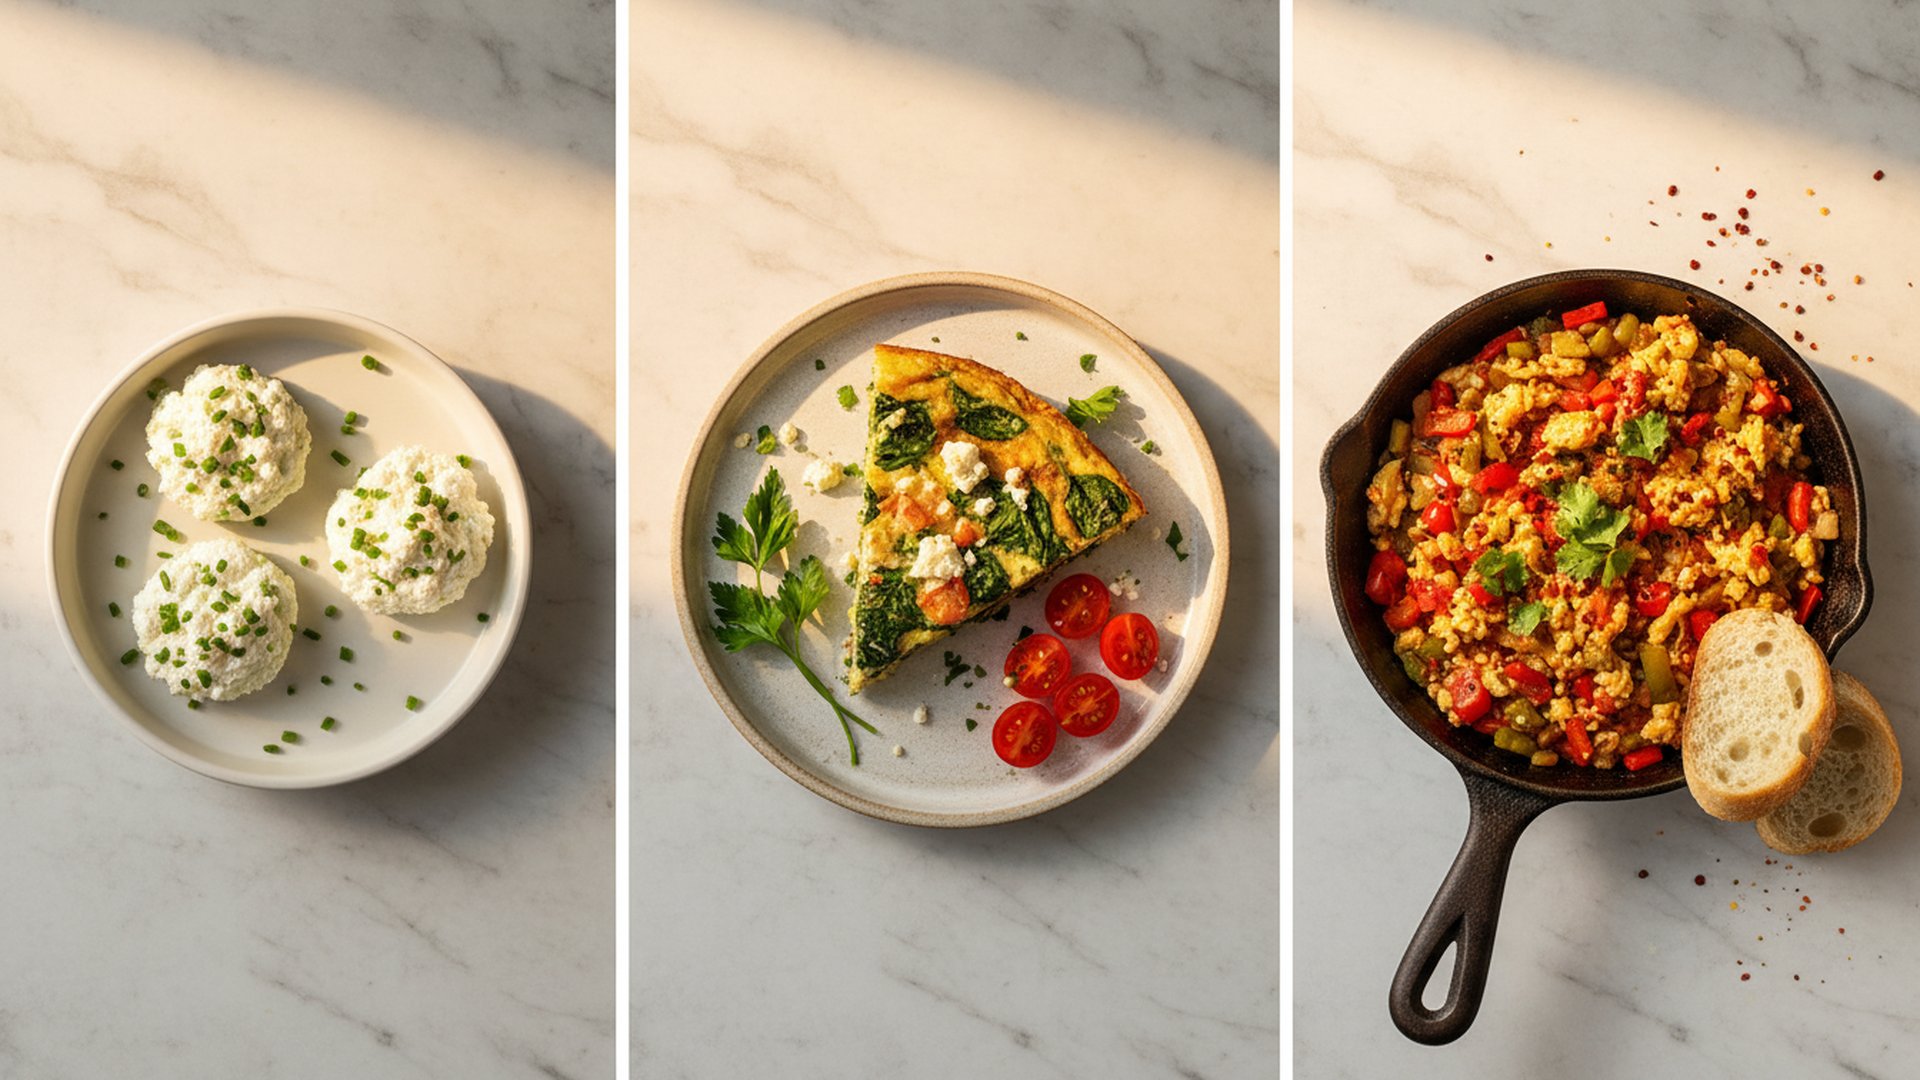
(We relabeled the column “What’s Around the Eggs” instead of “Method” because the data proved method is irrelevant. It’s what you add, not how you heat it.)
The Chicken Test
If the frame thesis holds, it should survive within a single protein source. Chicken is the largest group — 35 recipes, 26% of our catalog. Five examples from top to bottom:
| Recipe | Carbs | Fat | Efficiency |
|---|---|---|---|
| Filipino Chicken Adobo | 3g | 13g | 13.36 |
| Chicken Noodle Soup | 23g | 10g | 13.05 |
| Chicken Skewers & Tzatziki | 15g | 16g | 11.87 |
| … | |||
| Greek Lemon Chicken & Orzo | 53g | 24g | 6.85 |
| Honey Sriracha Chicken Stir-Fry | 60g | 27g | 5.61 |
Same protein source. 7.7-point spread. The adobo wins with only 3g carbs despite 13g fat — a soy-vinegar braise adds flavor with almost no caloric weight. The chicken noodle soup sits right behind it with broth as the caloric base — low-fat, moderate carbs, mostly water. The stir-fry loses with 60g of carbs from noodles and sauce.
35 chicken recipes. 7.7-point spread. Same protein source. The frame determines most of it.
What Didn’t Matter
Three things that should predict protein-to-calorie ratio but mostly don’t:
Cooking method. No-cook recipes average 10.2 against a site-wide 8.3. Sounds like a stove problem — but control for ingredients and most of the gap closes: cooked recipes with less than 30g carbs average 8.9. The residual advantage isn’t the missing stove, it’s what no-cook recipes on this site are made of — cottage cheese bowls and yogurt parfaits built on lean dairy. Make a no-cook pasta salad and the advantage vanishes.
Ingredient count. Explains 21% of the variation — a distant fourth behind the macro factors, and mostly a proxy for them (more ingredients usually means more carbs and fat on the plate, not more protein). A 3-ingredient pasta has terrible efficiency. A 15-ingredient chicken soup has excellent efficiency. Simplicity is not a strategy. Macros are.
Recipe complexity. We tested it. Doesn’t predict. You can have a complex, efficient recipe (Filipino adobo: 7 ingredients, 13.4 efficiency) or a simple, low-efficiency one (bean tacos: 6 ingredients, 4.6 — delicious, just not optimized for this metric). Complexity is a red herring.
So what does matter? Go back to the frame: the macros of what you build around the protein. That’s the lever. Everything else is noise you can ignore.
The Plant-Based Ceiling
One finding the data doesn’t let us dance around:
| Protein Source | Avg Efficiency | Spread | Can You Optimize? |
|---|---|---|---|
| Greek yogurt (14) | 9.92 | 9.2 pts | Yes — wide range |
| Eggs (17) | 9.22 | 14.3 pts | Yes — widest range |
| Chicken (35) | 8.70 | 7.7 pts | Yes — wide range |
| Beef (11) | 7.48 | 4.9 pts | Some room |
| Lentils (3) | 6.43 | 1.5 pts | Limited (small sample) |
| Tofu (5) | 6.29 | 2.0 pts | Limited |
| Beans (6) | 5.22 | 1.2 pts | Limited (small sample) |
Greek yogurt, eggs, and chicken average 8.7–9.9 with 8–14 point spreads. You can build them efficient or inefficient depending on the frame. Beans average 5.2 with a 1.2-point spread. Lentils: 6.4, 1.5-point spread. (We only have 3 lentil and 6 bean recipes — so the narrow spreads partly reflect small sample sizes, not just structural limits.)
Why? Plant-based proteins carry carbohydrates structurally — they’re built into the protein source itself, not added by the recipe. A black bean has ~13g carbs per 7g protein. A chicken breast: ~0g carbs per 31g protein. No recipe redesign closes that gap.
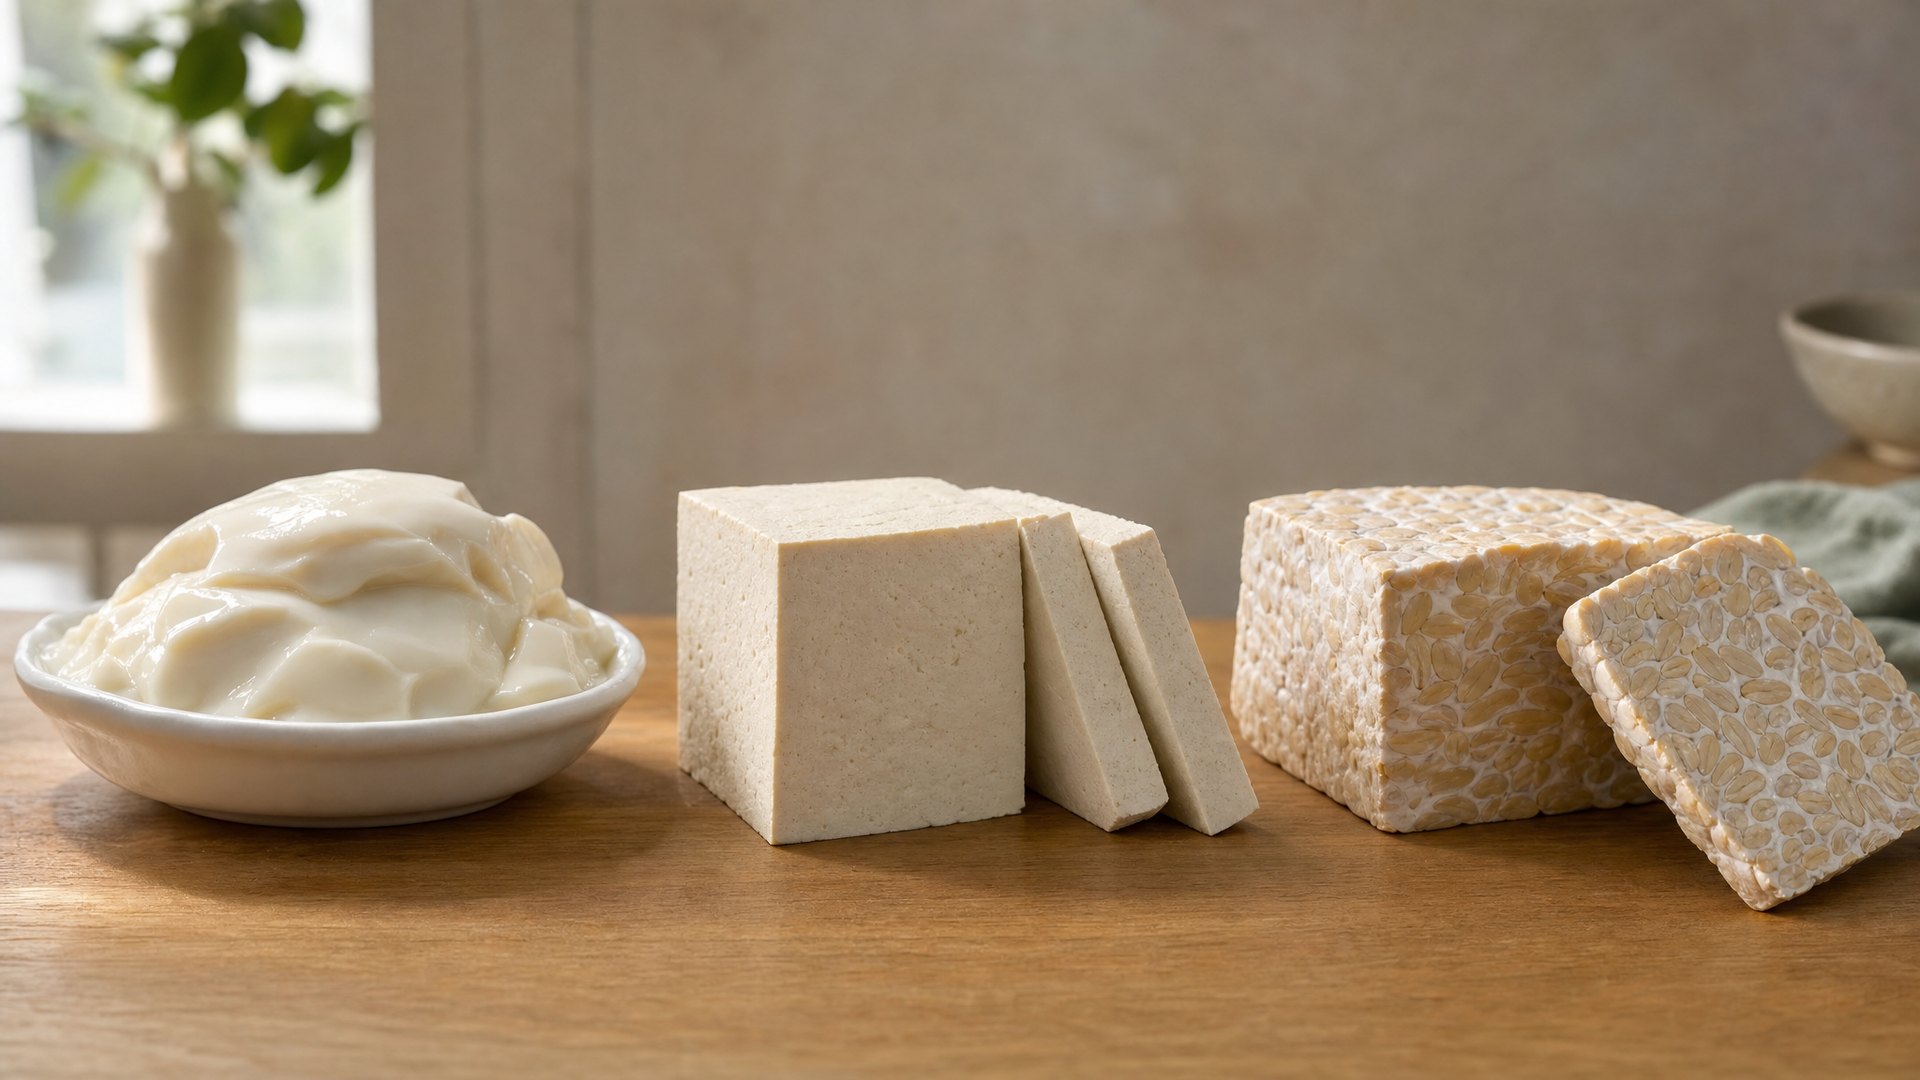
This doesn’t make plant proteins bad. They solve problems animal proteins can’t — fiber, cost, environmental footprint, variety. But for protein-to-calorie ratio specifically, they have a structural ceiling. If you’re plant-based and optimizing for this metric, your best options: tofu (6.3 avg, 5 recipes in our data), tempeh (higher protein density than tofu, firmer texture), and edamame (whole-food, minimal processing). Seitan scores well in theory (lower carb-to-protein ratio than legumes) but we only have one seitan recipe to confirm it. (Both things can be true. A food can be excellent for six reasons and suboptimal for one.)
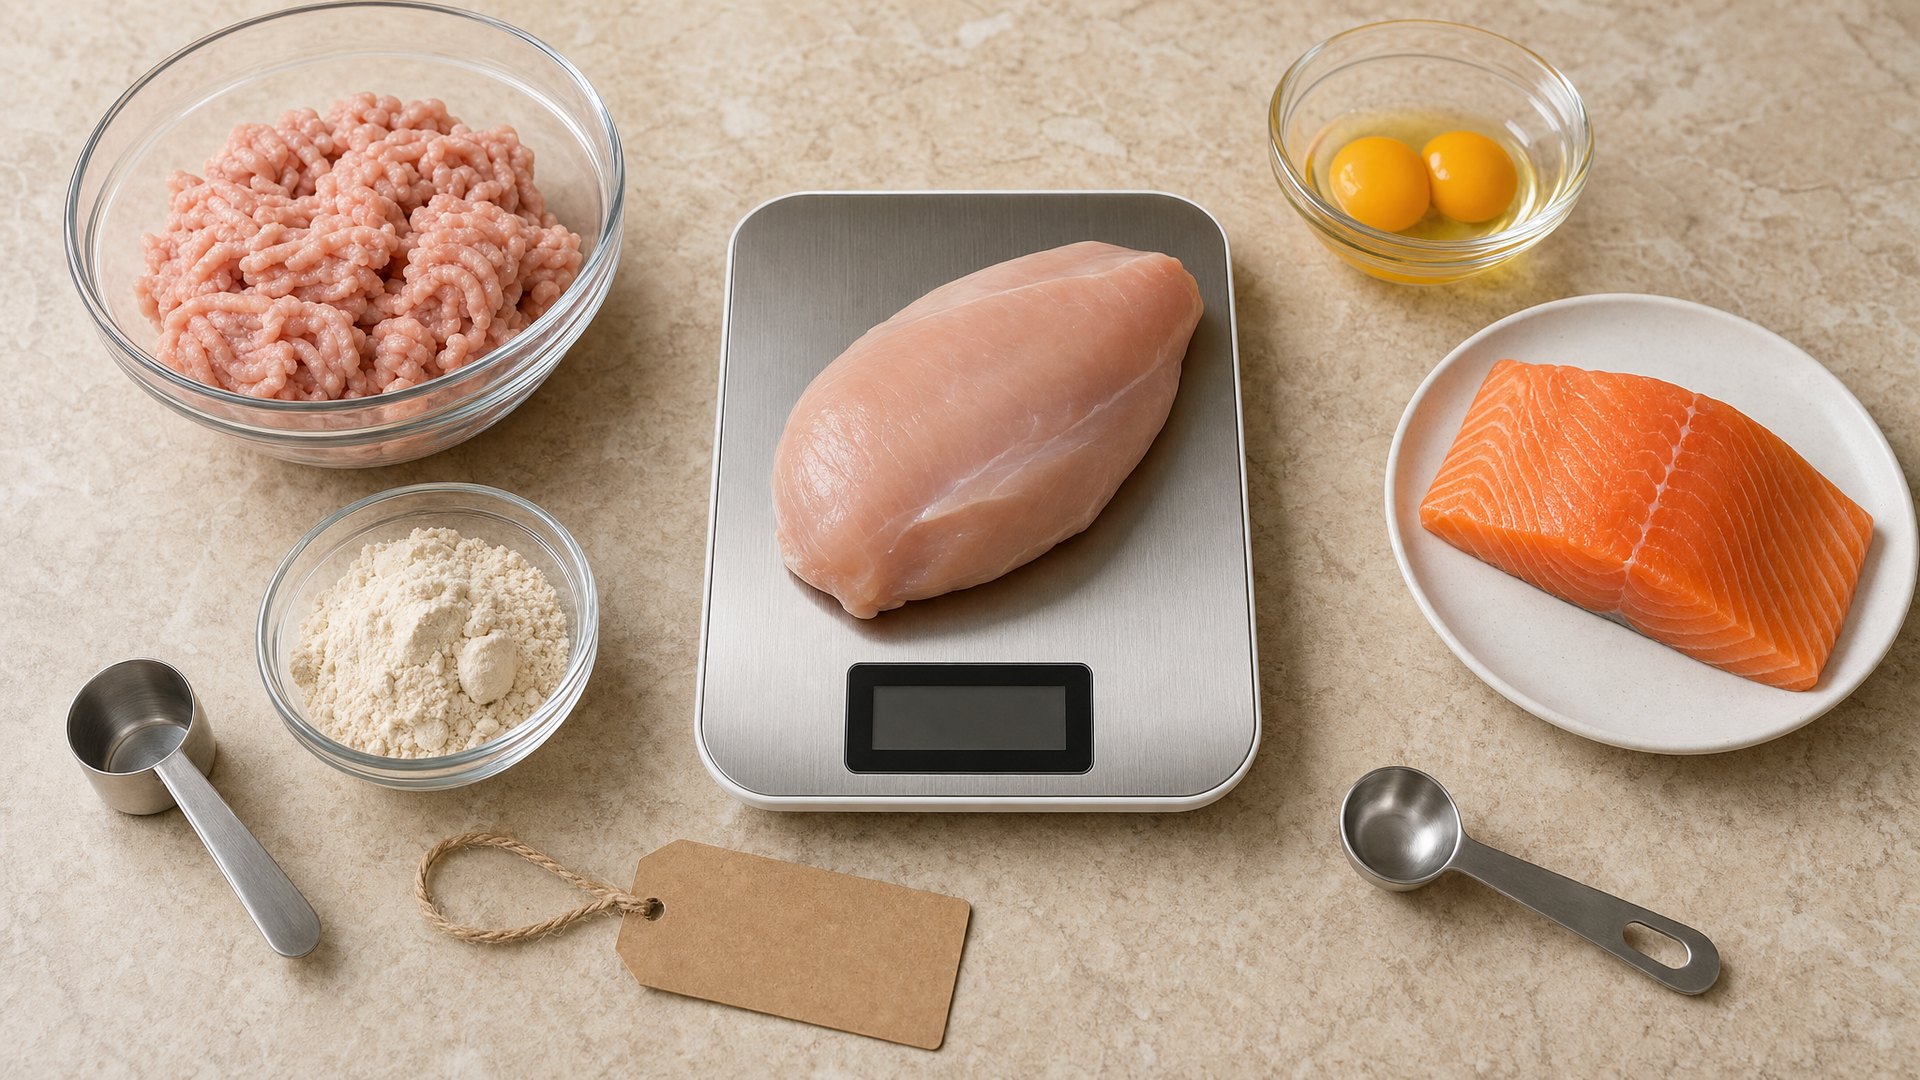
A note on protein powder. Yes, adding a scoop of whey or plant protein to oats, smoothies, or pancakes is the fastest way to boost any recipe’s efficiency score. We didn’t include it as a variable because it’s an additive — it changes the recipe rather than revealing what drives the ratio. But if you’re struggling to hit your protein target on limited calories, a scoop of powder in your morning oats is a legitimate shortcut. Several of our top-scoring breakfast recipes already use it.
Five Meals That Solve Both Problems
Most recipes force a trade: high total protein or high efficiency. These five deliver both — 50g+ protein AND 10g+ per 100 calories:
| Recipe | Protein | Calories | Efficiency |
|---|---|---|---|
| Chicken Noodle Soup | 50g | 387 | 13.0 |
| Lemon Herb Chicken Meal Prep | 66g | 576 | 11.4 |
| Shrimp Tacos with Lime Crema | 54g | 477 | 11.3 |
| Cajun Shrimp & Cauliflower Rice | 53g | 492 | 10.8 |
| Crispy Gochujang Chicken Breast | 54g | 507 | 10.7 |
What they share: lean frames — broth, vegetables, cauliflower rice, and yogurt-based crema instead of rice, oil, and cream. Filipino adobo tops the whole dinner chart at 13.4 with just soy sauce and vinegar as its frame, but its 37g serving misses the 50g bar. Flavor without caloric weight.
Full rankings of all 133 recipes: The Complete Protein-Per-Calorie Ranking →
The Bottom Line
Fat is twice as punishing per gram as carbs — but both matter, and the total non-protein load matters most. The frame you build around your protein explains more about a recipe’s efficiency than the protein source itself. Cooking method, complexity, and ingredient count are noise.
When efficiency matters: cutting weight, fitting protein into limited calories, or stretching a calorie budget. When to ignore it: feeding a family, bulking, or when a meal’s fiber, satisfaction, and flavor matter more than density. A low ratio doesn’t mean a bad meal — it means the meal is optimizing for something other than protein density.
When your “high-protein” meal disappoints, don’t blame the chicken. Look at what you built around it.
Methodology: 133 published recipes (all protein-optimized, 17–66g per serving), USDA-sourced nutrition data — the same figures we later stress-tested to see whether those protein claims hold up under USDA math. Statistical analysis: correlation analysis and multiple regression. All results statistically significant except where noted. These findings describe patterns within high-protein meals specifically — the core principle (non-protein calories dilute the ratio) applies universally, but the exact numbers are fitted to this dataset.
- How Much Protein Do You Actually Need? — Know your target before optimizing.
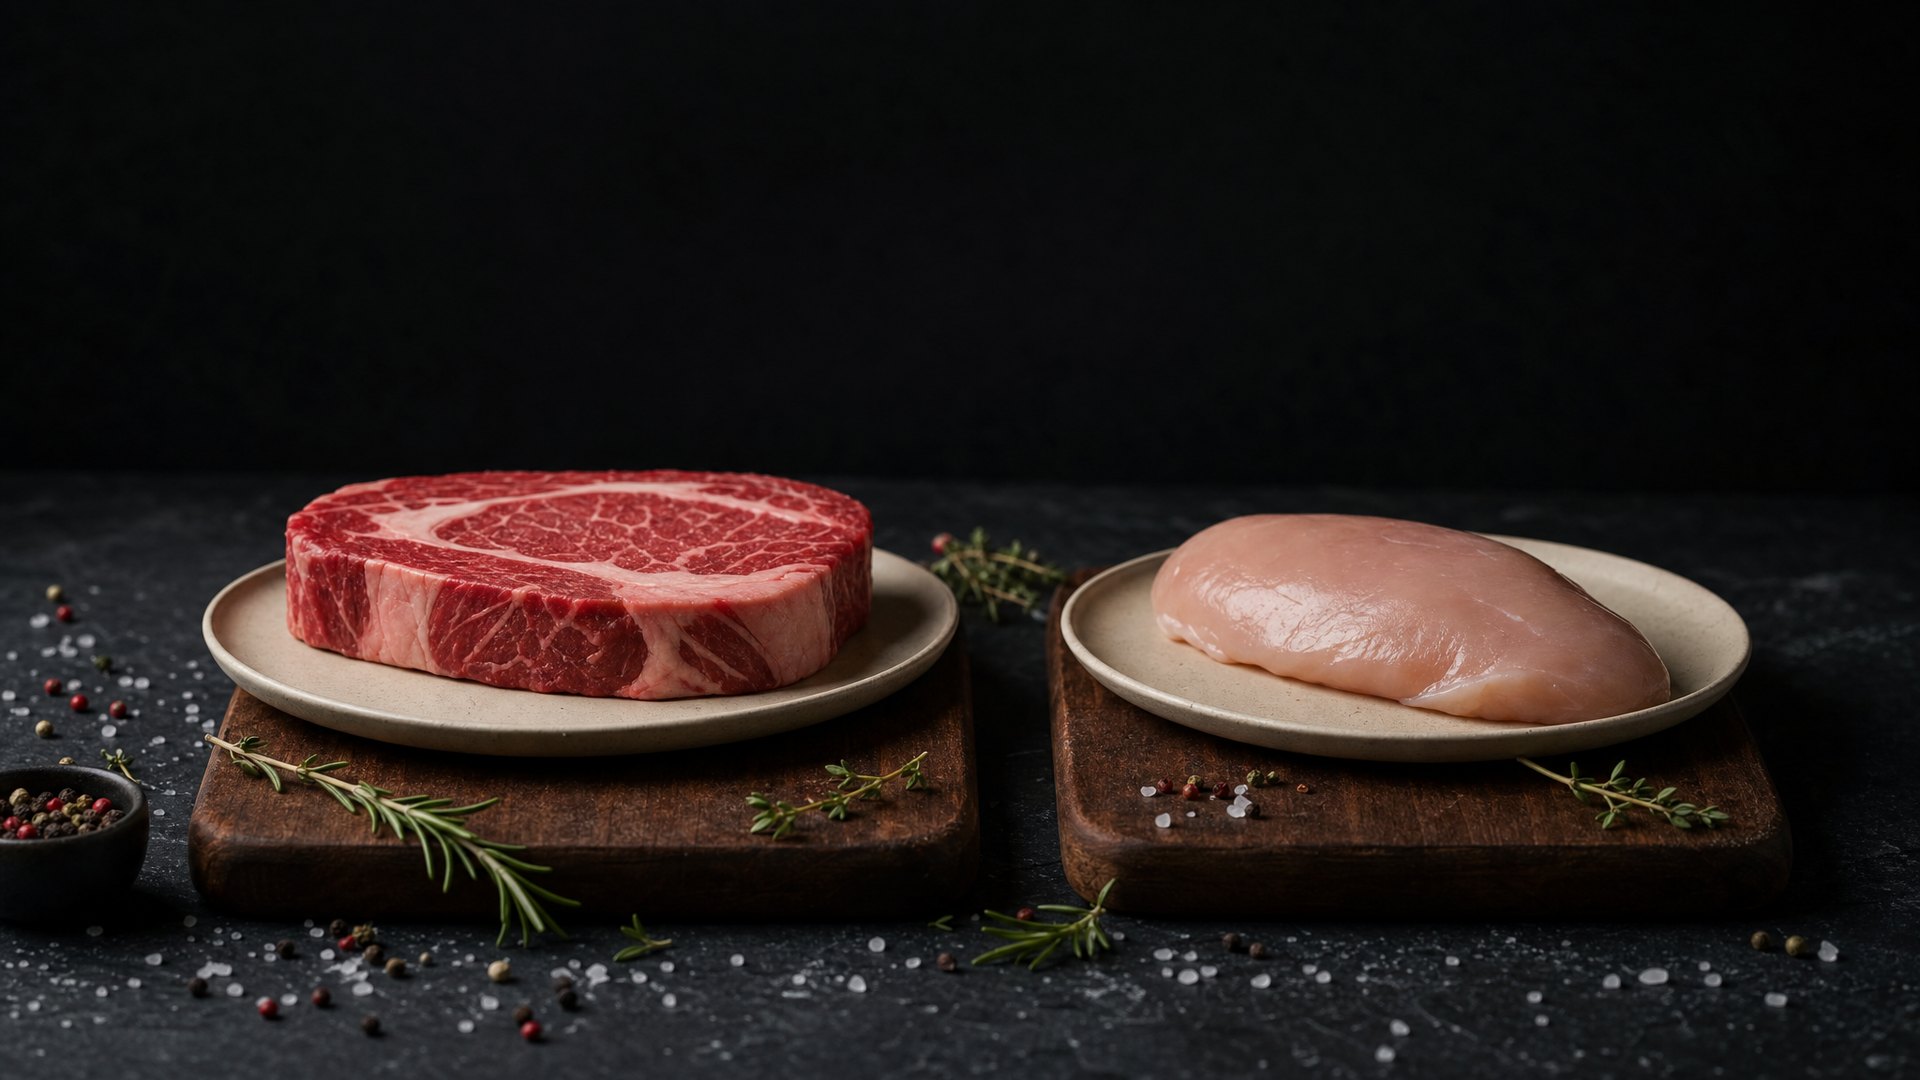
- Chicken, Beef, and Fish Compared — The protein source debate, settled.
Featured Recipes
All 5 recipes from this article, ready to cook
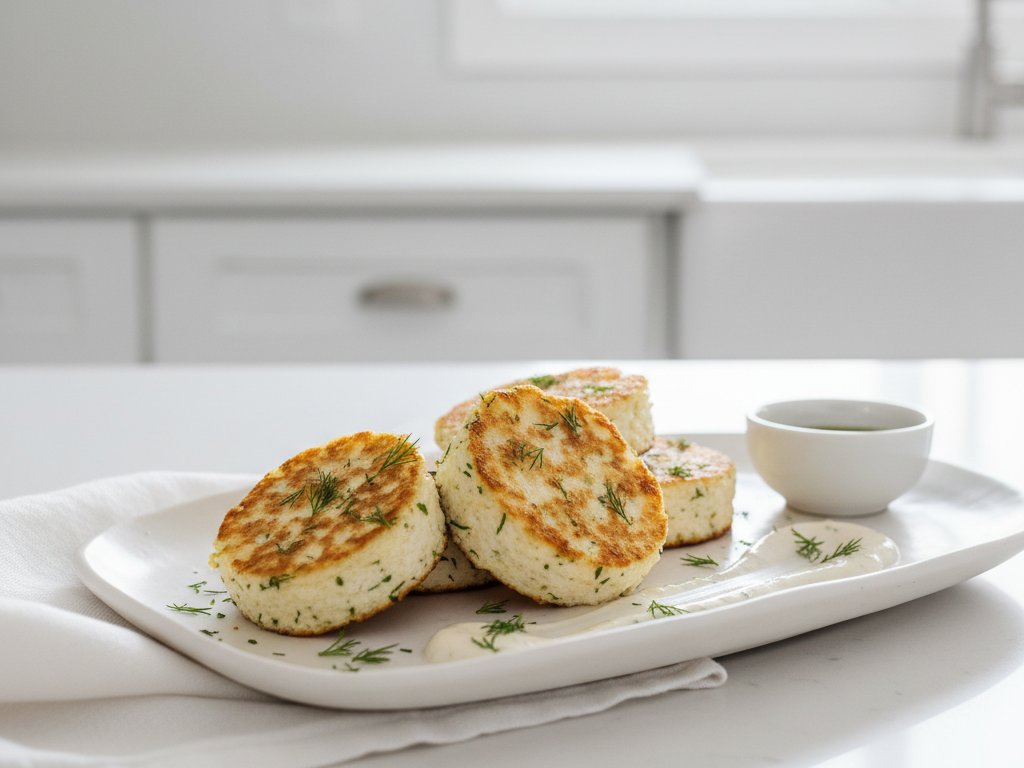
1. Easy Cottage Cheese Egg White Bites
Fresh dill tops seasoned cottage cheese on tender egg whites. 24g protein, just 124 cal, no cooking needed. The ultimate high-protein quick bite.
View Recipe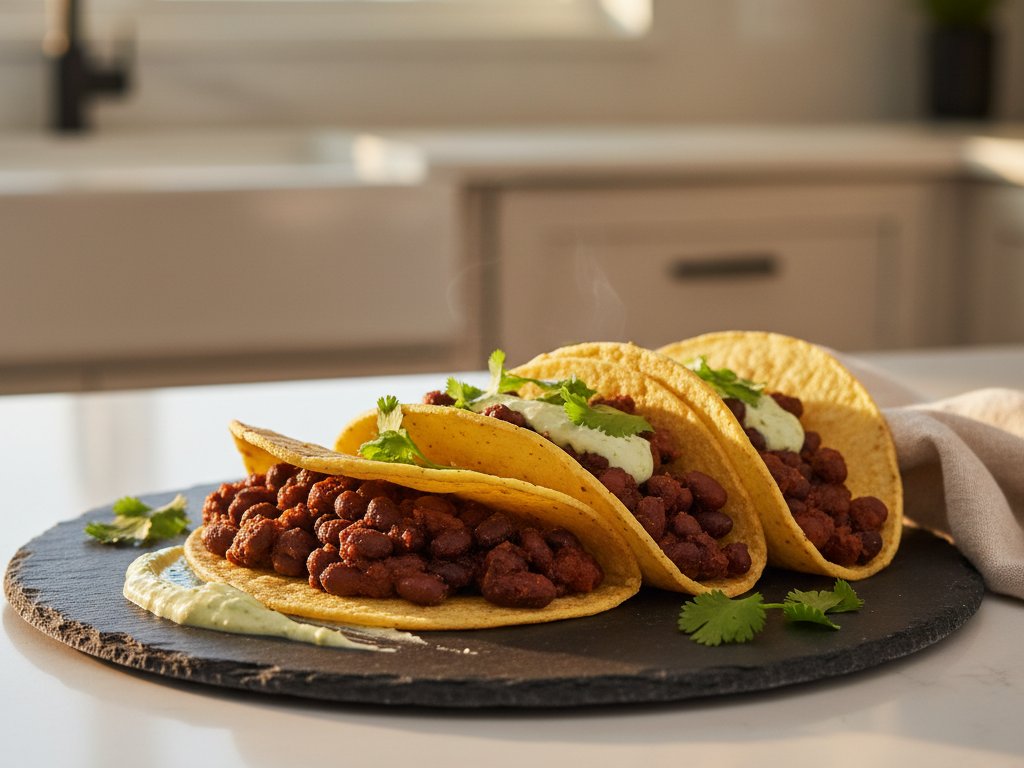
2. Spicy Black Bean Tacos with Lime Crema
Cumin-spiced black beans with tangy lime crema and cotija. 30g protein, 658 cal, ready in 20 min. Vegetarian comfort.
View Recipe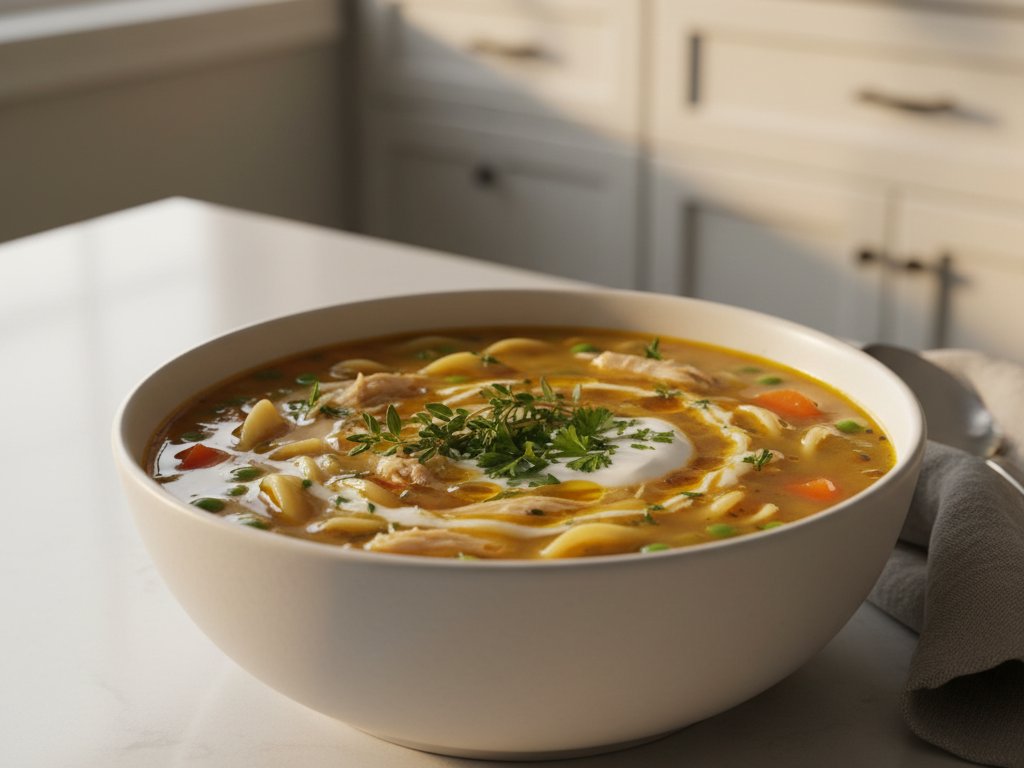
3. Hearty Chicken Noodle Soup
Tender chicken breast and silky egg noodles swimming in aromatic, golden broth. 50g protein, 387 cal. Classic comfort in 50 min.
View Recipe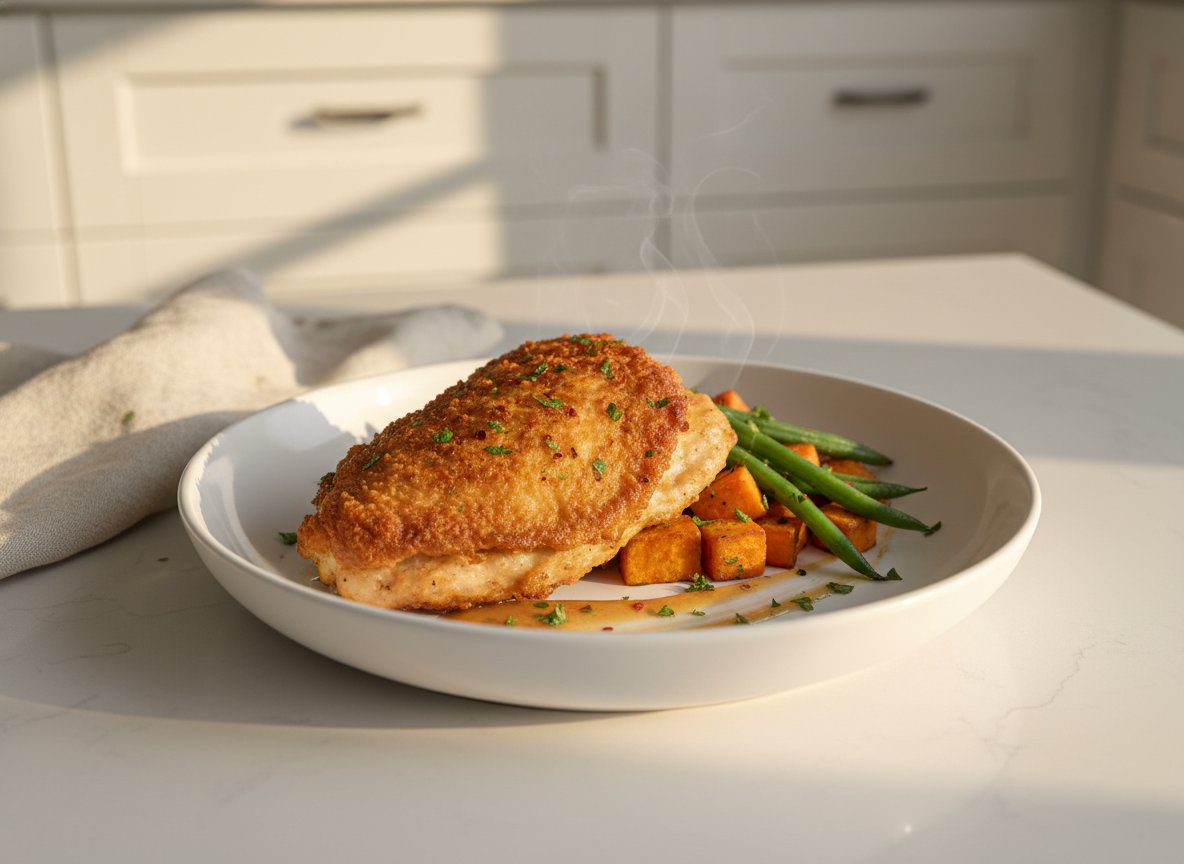
4. Crispy Air Fryer Chicken Thighs
Air fryer chicken thighs at 380°F in 35 min — crispy skin, juicy meat, 60g protein per serving. Simple smoked paprika spice rub, no deep-frying needed.
View Recipe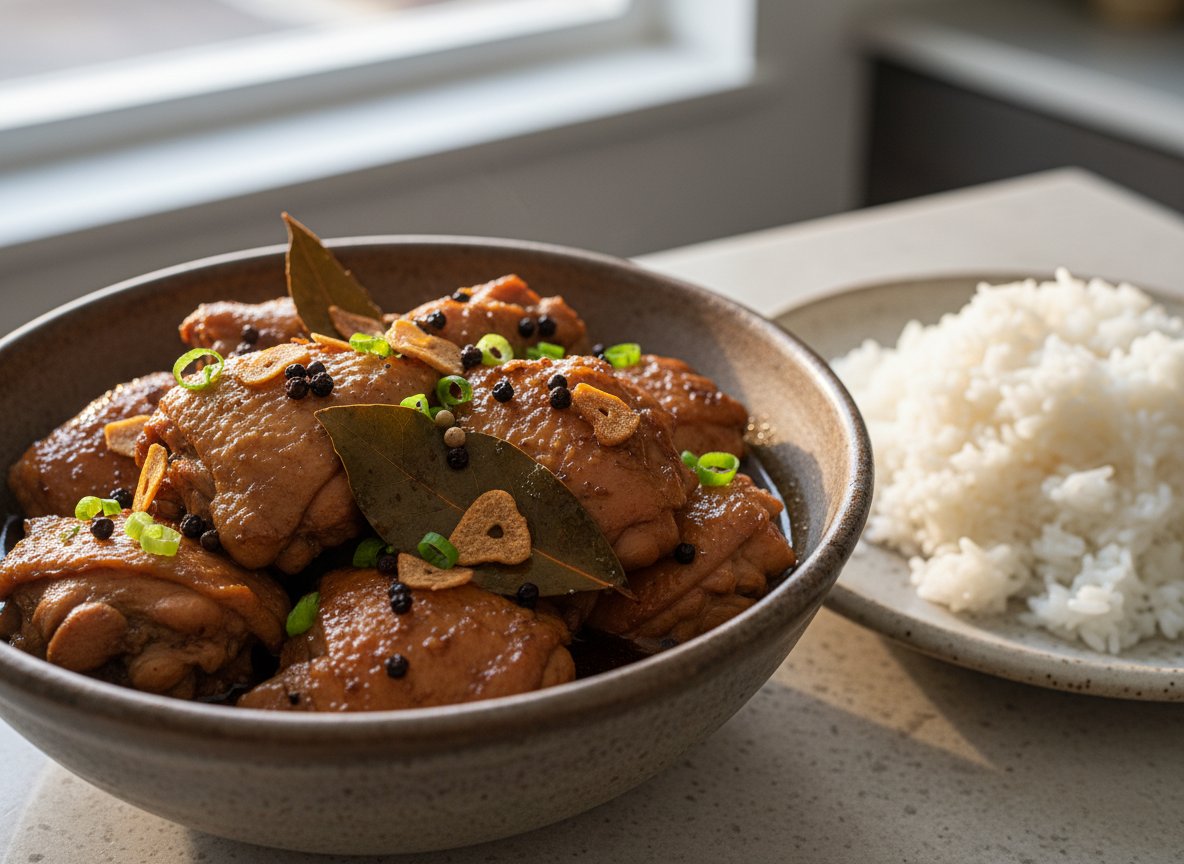
5. Filipino Chicken Adobo
Tangy soy-vinegar braise with fall-apart chicken thighs. 37g protein, 277 cal, 55 min. Garlic, bay leaves, and whole peppercorns build concentrated flavor.
View Recipe